Acanthamoeba castellanii str. Neff
Taxonomy: cellular organisms; Eukaryota; Amoebozoa; Discosea; Longamoebia; Centramoebida; Acanthamoebidae; Acanthamoeba; Acanthamoeba castellanii
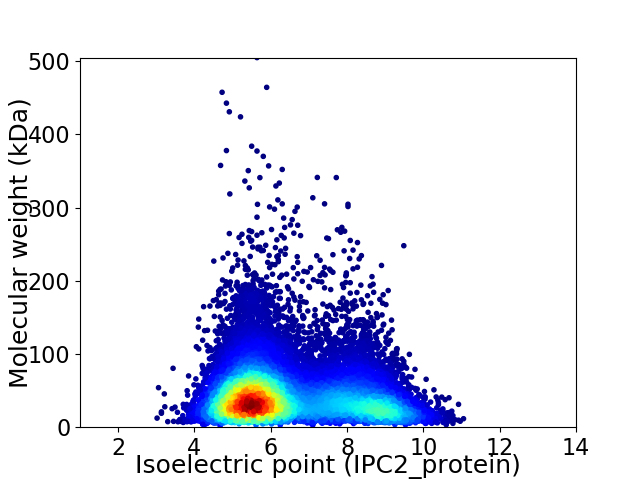
Average proteome isoelectric point is 6.49
Get precalculated fractions of proteins

Virtual 2D-PAGE plot for 14939 proteins (isoelectric point calculated using IPC2_protein)
Get csv file with sequences according to given criteria:
* You can choose from 21 different methods for calculating isoelectric point
Summary statistics related to proteome-wise predictions


Protein with the lowest isoelectric point:
>tr|L8H3F0|L8H3F0_ACACA Homeobox domain containing protein OS=Acanthamoeba castellanii str. Neff OX=1257118 GN=ACA1_264140 PE=4 SV=1
MM1 pKa = 7.09TRR3 pKa = 11.84VALWALVGLILSIAVLSCSASDD25 pKa = 3.75GEE27 pKa = 4.6RR28 pKa = 11.84VKK30 pKa = 10.93RR31 pKa = 11.84PARR34 pKa = 11.84HH35 pKa = 6.66DD36 pKa = 4.01YY37 pKa = 11.05DD38 pKa = 4.28YY39 pKa = 11.66DD40 pKa = 5.7DD41 pKa = 5.77YY42 pKa = 11.92DD43 pKa = 4.22DD44 pKa = 5.95CEE46 pKa = 5.27RR47 pKa = 11.84DD48 pKa = 3.82DD49 pKa = 4.59NEE51 pKa = 4.97HH52 pKa = 6.54EE53 pKa = 4.51VACGYY58 pKa = 9.86GKK60 pKa = 10.04SWGSCEE66 pKa = 5.94DD67 pKa = 5.37DD68 pKa = 5.03DD69 pKa = 5.32DD70 pKa = 5.09CPPIALILEE79 pKa = 4.47LEE81 pKa = 4.16EE82 pKa = 4.23QEE84 pKa = 5.08GGEE87 pKa = 4.05DD88 pKa = 3.84SCWEE92 pKa = 4.16EE93 pKa = 4.81EE94 pKa = 4.73DD95 pKa = 5.11DD96 pKa = 4.18EE97 pKa = 4.8CTGGSPTTTTTSGGHH112 pKa = 4.35TTGGGHH118 pKa = 5.13STGGDD123 pKa = 3.07GSTGGEE129 pKa = 4.03NGGSDD134 pKa = 3.83TPVGAIVGGVLGGVFGAAAVGAAGAGAGYY163 pKa = 10.95ALYY166 pKa = 10.83RR167 pKa = 11.84FMQRR171 pKa = 11.84GGASPMPASAMDD183 pKa = 3.96GTEE186 pKa = 3.85MATMNDD192 pKa = 3.0NALFQSPTEE201 pKa = 3.91GHH203 pKa = 6.28TNDD206 pKa = 4.6LFQSGAMAAADD217 pKa = 3.43AVV219 pKa = 3.73
MM1 pKa = 7.09TRR3 pKa = 11.84VALWALVGLILSIAVLSCSASDD25 pKa = 3.75GEE27 pKa = 4.6RR28 pKa = 11.84VKK30 pKa = 10.93RR31 pKa = 11.84PARR34 pKa = 11.84HH35 pKa = 6.66DD36 pKa = 4.01YY37 pKa = 11.05DD38 pKa = 4.28YY39 pKa = 11.66DD40 pKa = 5.7DD41 pKa = 5.77YY42 pKa = 11.92DD43 pKa = 4.22DD44 pKa = 5.95CEE46 pKa = 5.27RR47 pKa = 11.84DD48 pKa = 3.82DD49 pKa = 4.59NEE51 pKa = 4.97HH52 pKa = 6.54EE53 pKa = 4.51VACGYY58 pKa = 9.86GKK60 pKa = 10.04SWGSCEE66 pKa = 5.94DD67 pKa = 5.37DD68 pKa = 5.03DD69 pKa = 5.32DD70 pKa = 5.09CPPIALILEE79 pKa = 4.47LEE81 pKa = 4.16EE82 pKa = 4.23QEE84 pKa = 5.08GGEE87 pKa = 4.05DD88 pKa = 3.84SCWEE92 pKa = 4.16EE93 pKa = 4.81EE94 pKa = 4.73DD95 pKa = 5.11DD96 pKa = 4.18EE97 pKa = 4.8CTGGSPTTTTTSGGHH112 pKa = 4.35TTGGGHH118 pKa = 5.13STGGDD123 pKa = 3.07GSTGGEE129 pKa = 4.03NGGSDD134 pKa = 3.83TPVGAIVGGVLGGVFGAAAVGAAGAGAGYY163 pKa = 10.95ALYY166 pKa = 10.83RR167 pKa = 11.84FMQRR171 pKa = 11.84GGASPMPASAMDD183 pKa = 3.96GTEE186 pKa = 3.85MATMNDD192 pKa = 3.0NALFQSPTEE201 pKa = 3.91GHH203 pKa = 6.28TNDD206 pKa = 4.6LFQSGAMAAADD217 pKa = 3.43AVV219 pKa = 3.73
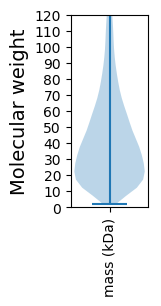
Molecular weight: 22.33 kDa
Isoelectric point according different methods:
Protein with the highest isoelectric point:
>tr|L8GNE6|L8GNE6_ACACA Carrier superfamily protein OS=Acanthamoeba castellanii str. Neff OX=1257118 GN=ACA1_193100 PE=3 SV=1
MM1 pKa = 6.62TARR4 pKa = 11.84RR5 pKa = 11.84RR6 pKa = 11.84PPRR9 pKa = 11.84STSAPPPRR17 pKa = 11.84STTARR22 pKa = 11.84RR23 pKa = 11.84PPPRR27 pKa = 11.84STAARR32 pKa = 11.84RR33 pKa = 11.84PPPRR37 pKa = 11.84SPSAPLPRR45 pKa = 11.84SPSARR50 pKa = 11.84PRR52 pKa = 11.84CPGTMTRR59 pKa = 11.84RR60 pKa = 11.84SATGSATRR68 pKa = 11.84SAPRR72 pKa = 11.84SPTTPRR78 pKa = 11.84RR79 pKa = 11.84PPRR82 pKa = 11.84STALPPRR89 pKa = 11.84STPRR93 pKa = 11.84PPSIAPGSSASTPTEE108 pKa = 3.79HH109 pKa = 7.47
MM1 pKa = 6.62TARR4 pKa = 11.84RR5 pKa = 11.84RR6 pKa = 11.84PPRR9 pKa = 11.84STSAPPPRR17 pKa = 11.84STTARR22 pKa = 11.84RR23 pKa = 11.84PPPRR27 pKa = 11.84STAARR32 pKa = 11.84RR33 pKa = 11.84PPPRR37 pKa = 11.84SPSAPLPRR45 pKa = 11.84SPSARR50 pKa = 11.84PRR52 pKa = 11.84CPGTMTRR59 pKa = 11.84RR60 pKa = 11.84SATGSATRR68 pKa = 11.84SAPRR72 pKa = 11.84SPTTPRR78 pKa = 11.84RR79 pKa = 11.84PPRR82 pKa = 11.84STALPPRR89 pKa = 11.84STPRR93 pKa = 11.84PPSIAPGSSASTPTEE108 pKa = 3.79HH109 pKa = 7.47
Molecular weight: 11.58 kDa
Isoelectric point according different methods:
Peptides (in silico digests for buttom-up proteomics)
Below you can find in silico digests of the whole proteome with Trypsin, Chymotrypsin, Trypsin+LysC, LysN, ArgC proteases suitable for different mass spec machines.| Try ESI |
 |
|---|
| ChTry ESI |
 |
|---|
| ArgC ESI |
 |
|---|
| LysN ESI |
 |
|---|
| TryLysC ESI |
 |
|---|
| Try MALDI |
 |
|---|
| ChTry MALDI |
 |
|---|
| ArgC MALDI |
 |
|---|
| LysN MALDI |
 |
|---|
| TryLysC MALDI |
 |
|---|
| Try LTQ |
 |
|---|
| ChTry LTQ |
 |
|---|
| ArgC LTQ |
 |
|---|
| LysN LTQ |
 |
|---|
| TryLysC LTQ |
 |
|---|
| Try MSlow |
 |
|---|
| ChTry MSlow |
 |
|---|
| ArgC MSlow |
 |
|---|
| LysN MSlow |
 |
|---|
| TryLysC MSlow |
 |
|---|
| Try MShigh |
 |
|---|
| ChTry MShigh |
 |
|---|
| ArgC MShigh |
 |
|---|
| LysN MShigh |
 |
|---|
| TryLysC MShigh |
 |
|---|
General Statistics
Number of major isoforms |
Number of additional isoforms |
Number of all proteins |
Number of amino acids |
Min. Seq. Length |
Max. Seq. Length |
Avg. Seq. Length |
Avg. Mol. Weight |
|---|---|---|---|---|---|---|---|
6560542 |
16 |
4479 |
439.2 |
48.48 |
Amino acid frequency
Ala |
Cys |
Asp |
Glu |
Phe |
Gly |
His |
Ile |
Lys |
Leu |
|---|---|---|---|---|---|---|---|---|---|
9.81 ± 0.025 | 1.408 ± 0.01 |
5.603 ± 0.016 | 6.968 ± 0.029 |
3.477 ± 0.013 | 6.888 ± 0.021 |
2.663 ± 0.013 | 3.783 ± 0.013 |
5.238 ± 0.023 | 9.353 ± 0.023 |
Met |
Asn |
Gln |
Pro |
Arg |
Ser |
Thr |
Val |
Trp |
Tyr |
|---|---|---|---|---|---|---|---|---|---|
2.088 ± 0.008 | 3.143 ± 0.011 |
5.528 ± 0.021 | 4.055 ± 0.016 |
6.339 ± 0.02 | 7.656 ± 0.027 |
5.622 ± 0.014 | 6.513 ± 0.018 |
1.352 ± 0.007 | 2.507 ± 0.011 |
Most of the basic statistics you can see at this page can be downloaded from this CSV file
Proteome-pI is available under Creative Commons Attribution-NoDerivs license, for more details see here
| Reference: Kozlowski LP. Proteome-pI 2.0: Proteome Isoelectric Point Database Update. Nucleic Acids Res. 2021, doi: 10.1093/nar/gkab944 | Contact: Lukasz P. Kozlowski |
