Tomato mosaic Trujillo virus
Taxonomy: Viruses; Monodnaviria; Shotokuvirae; Cressdnaviricota; Repensiviricetes; Geplafuvirales; Geminiviridae; Begomovirus; Tomato wrinkled mosaic virus
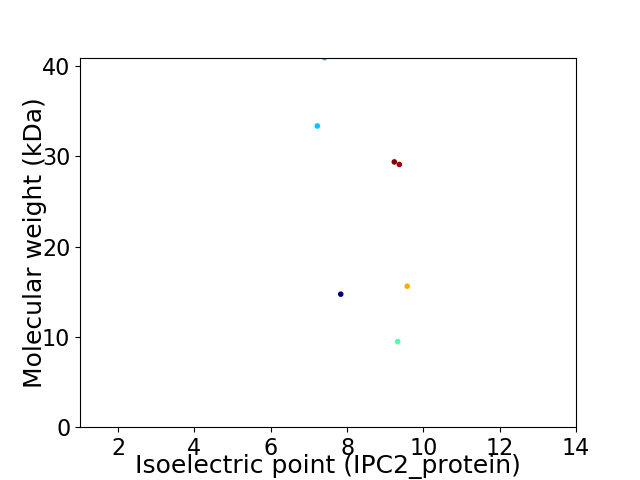
Average proteome isoelectric point is 8.26
Get precalculated fractions of proteins

Virtual 2D-PAGE plot for 7 proteins (isoelectric point calculated using IPC2_protein)
Get csv file with sequences according to given criteria:
* You can choose from 21 different methods for calculating isoelectric point
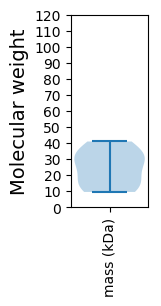
Summary statistics related to proteome-wise predictions


Protein with the lowest isoelectric point:
>tr|A0A218MXV5|A0A218MXV5_9GEMI Nuclear shuttle protein OS=Tomato mosaic Trujillo virus OX=2015440 GN=NSP PE=3 SV=1
MM1 pKa = 8.27DD2 pKa = 4.15SQLVNPPHH10 pKa = 6.55AFNYY14 pKa = 9.71IEE16 pKa = 4.15SHH18 pKa = 6.24RR19 pKa = 11.84DD20 pKa = 3.22EE21 pKa = 4.7YY22 pKa = 11.24QLSHH26 pKa = 7.5DD27 pKa = 3.72LTEE30 pKa = 4.56IVLQFPSTASQLTARR45 pKa = 11.84LSRR48 pKa = 11.84SCMKK52 pKa = 9.84IDD54 pKa = 3.26HH55 pKa = 6.45CVIEE59 pKa = 4.31YY60 pKa = 9.79RR61 pKa = 11.84QQVPINATGSVIVEE75 pKa = 3.82IHH77 pKa = 7.1DD78 pKa = 4.31KK79 pKa = 11.26RR80 pKa = 11.84MTDD83 pKa = 3.41NEE85 pKa = 4.36SLQASWTFPIRR96 pKa = 11.84CNIDD100 pKa = 2.86LHH102 pKa = 6.12YY103 pKa = 10.57FSASFFSLKK112 pKa = 10.83DD113 pKa = 3.77PIPWKK118 pKa = 10.3LYY120 pKa = 10.64YY121 pKa = 9.61RR122 pKa = 11.84VCDD125 pKa = 3.8TNVHH129 pKa = 5.05QRR131 pKa = 11.84THH133 pKa = 5.37FAKK136 pKa = 10.85FKK138 pKa = 10.96GKK140 pKa = 10.52LKK142 pKa = 10.82LSTAKK147 pKa = 10.37HH148 pKa = 5.69SVDD151 pKa = 2.95IPFRR155 pKa = 11.84APTVKK160 pKa = 10.11ILSKK164 pKa = 10.79QFTDD168 pKa = 3.13KK169 pKa = 11.25DD170 pKa = 3.57VDD172 pKa = 4.22FSHH175 pKa = 7.29VDD177 pKa = 3.13YY178 pKa = 11.23GRR180 pKa = 11.84WEE182 pKa = 4.05RR183 pKa = 11.84KK184 pKa = 9.17PIRR187 pKa = 11.84CASMSRR193 pKa = 11.84VGLRR197 pKa = 11.84GPIEE201 pKa = 3.96IRR203 pKa = 11.84PGEE206 pKa = 4.2SWASRR211 pKa = 11.84STIGTGHH218 pKa = 6.19SEE220 pKa = 3.94ADD222 pKa = 3.34SEE224 pKa = 5.11VEE226 pKa = 4.55NEE228 pKa = 3.86LHH230 pKa = 7.24PYY232 pKa = 9.59RR233 pKa = 11.84HH234 pKa = 6.68LSRR237 pKa = 11.84LGTTVLDD244 pKa = 4.4PGEE247 pKa = 4.24SASVIGAQRR256 pKa = 11.84AEE258 pKa = 4.37SNITMSMGQLNEE270 pKa = 4.06LVRR273 pKa = 11.84TTVQEE278 pKa = 4.74CINSNCRR285 pKa = 11.84PSQPKK290 pKa = 10.09SLQQ293 pKa = 3.18
MM1 pKa = 8.27DD2 pKa = 4.15SQLVNPPHH10 pKa = 6.55AFNYY14 pKa = 9.71IEE16 pKa = 4.15SHH18 pKa = 6.24RR19 pKa = 11.84DD20 pKa = 3.22EE21 pKa = 4.7YY22 pKa = 11.24QLSHH26 pKa = 7.5DD27 pKa = 3.72LTEE30 pKa = 4.56IVLQFPSTASQLTARR45 pKa = 11.84LSRR48 pKa = 11.84SCMKK52 pKa = 9.84IDD54 pKa = 3.26HH55 pKa = 6.45CVIEE59 pKa = 4.31YY60 pKa = 9.79RR61 pKa = 11.84QQVPINATGSVIVEE75 pKa = 3.82IHH77 pKa = 7.1DD78 pKa = 4.31KK79 pKa = 11.26RR80 pKa = 11.84MTDD83 pKa = 3.41NEE85 pKa = 4.36SLQASWTFPIRR96 pKa = 11.84CNIDD100 pKa = 2.86LHH102 pKa = 6.12YY103 pKa = 10.57FSASFFSLKK112 pKa = 10.83DD113 pKa = 3.77PIPWKK118 pKa = 10.3LYY120 pKa = 10.64YY121 pKa = 9.61RR122 pKa = 11.84VCDD125 pKa = 3.8TNVHH129 pKa = 5.05QRR131 pKa = 11.84THH133 pKa = 5.37FAKK136 pKa = 10.85FKK138 pKa = 10.96GKK140 pKa = 10.52LKK142 pKa = 10.82LSTAKK147 pKa = 10.37HH148 pKa = 5.69SVDD151 pKa = 2.95IPFRR155 pKa = 11.84APTVKK160 pKa = 10.11ILSKK164 pKa = 10.79QFTDD168 pKa = 3.13KK169 pKa = 11.25DD170 pKa = 3.57VDD172 pKa = 4.22FSHH175 pKa = 7.29VDD177 pKa = 3.13YY178 pKa = 11.23GRR180 pKa = 11.84WEE182 pKa = 4.05RR183 pKa = 11.84KK184 pKa = 9.17PIRR187 pKa = 11.84CASMSRR193 pKa = 11.84VGLRR197 pKa = 11.84GPIEE201 pKa = 3.96IRR203 pKa = 11.84PGEE206 pKa = 4.2SWASRR211 pKa = 11.84STIGTGHH218 pKa = 6.19SEE220 pKa = 3.94ADD222 pKa = 3.34SEE224 pKa = 5.11VEE226 pKa = 4.55NEE228 pKa = 3.86LHH230 pKa = 7.24PYY232 pKa = 9.59RR233 pKa = 11.84HH234 pKa = 6.68LSRR237 pKa = 11.84LGTTVLDD244 pKa = 4.4PGEE247 pKa = 4.24SASVIGAQRR256 pKa = 11.84AEE258 pKa = 4.37SNITMSMGQLNEE270 pKa = 4.06LVRR273 pKa = 11.84TTVQEE278 pKa = 4.74CINSNCRR285 pKa = 11.84PSQPKK290 pKa = 10.09SLQQ293 pKa = 3.18
Molecular weight: 33.36 kDa
Isoelectric point according different methods:
Protein with the highest isoelectric point:
>tr|A0A218MXV7|A0A218MXV7_9GEMI AC4 OS=Tomato mosaic Trujillo virus OX=2015440 GN=AC4 PE=3 SV=1
MM1 pKa = 7.31QMGSLISMCSSNSKK15 pKa = 10.53GNSTARR21 pKa = 11.84IRR23 pKa = 11.84DD24 pKa = 3.6CSIWCPQPGQYY35 pKa = 10.15ISIRR39 pKa = 11.84TYY41 pKa = 10.98RR42 pKa = 11.84EE43 pKa = 3.84LNPAPTSSPTSRR55 pKa = 11.84KK56 pKa = 8.2TGTPPNGGCSRR67 pKa = 11.84STAEE71 pKa = 3.7VLEE74 pKa = 4.17AVNRR78 pKa = 11.84HH79 pKa = 5.83LTTQPPRR86 pKa = 11.84RR87 pKa = 3.83
MM1 pKa = 7.31QMGSLISMCSSNSKK15 pKa = 10.53GNSTARR21 pKa = 11.84IRR23 pKa = 11.84DD24 pKa = 3.6CSIWCPQPGQYY35 pKa = 10.15ISIRR39 pKa = 11.84TYY41 pKa = 10.98RR42 pKa = 11.84EE43 pKa = 3.84LNPAPTSSPTSRR55 pKa = 11.84KK56 pKa = 8.2TGTPPNGGCSRR67 pKa = 11.84STAEE71 pKa = 3.7VLEE74 pKa = 4.17AVNRR78 pKa = 11.84HH79 pKa = 5.83LTTQPPRR86 pKa = 11.84RR87 pKa = 3.83
Molecular weight: 9.48 kDa
Isoelectric point according different methods:
Peptides (in silico digests for buttom-up proteomics)
Below you can find in silico digests of the whole proteome with Trypsin, Chymotrypsin, Trypsin+LysC, LysN, ArgC proteases suitable for different mass spec machines.| Try ESI |
 |
|---|
| ChTry ESI |
 |
|---|
| ArgC ESI |
 |
|---|
| LysN ESI |
 |
|---|
| TryLysC ESI |
 |
|---|
| Try MALDI |
 |
|---|
| ChTry MALDI |
 |
|---|
| ArgC MALDI |
 |
|---|
| LysN MALDI |
 |
|---|
| TryLysC MALDI |
 |
|---|
| Try LTQ |
 |
|---|
| ChTry LTQ |
 |
|---|
| ArgC LTQ |
 |
|---|
| LysN LTQ |
 |
|---|
| TryLysC LTQ |
 |
|---|
| Try MSlow |
 |
|---|
| ChTry MSlow |
 |
|---|
| ArgC MSlow |
 |
|---|
| LysN MSlow |
 |
|---|
| TryLysC MSlow |
 |
|---|
| Try MShigh |
 |
|---|
| ChTry MShigh |
 |
|---|
| ArgC MShigh |
 |
|---|
| LysN MShigh |
 |
|---|
| TryLysC MShigh |
 |
|---|
General Statistics
Number of major isoforms |
Number of additional isoforms |
Number of all proteins |
Number of amino acids |
Min. Seq. Length |
Max. Seq. Length |
Avg. Seq. Length |
Avg. Mol. Weight |
|---|---|---|---|---|---|---|---|
0 |
1512 |
87 |
365 |
216.0 |
24.66 |
Amino acid frequency
Ala |
Cys |
Asp |
Glu |
Phe |
Gly |
His |
Ile |
Lys |
Leu |
|---|---|---|---|---|---|---|---|---|---|
5.026 ± 0.786 | 1.984 ± 0.305 |
5.093 ± 0.543 | 4.828 ± 0.769 |
3.77 ± 0.417 | 6.085 ± 0.533 |
3.571 ± 0.347 | 5.423 ± 0.387 |
5.82 ± 0.683 | 6.548 ± 0.643 |
Met |
Asn |
Gln |
Pro |
Arg |
Ser |
Thr |
Val |
Trp |
Tyr |
|---|---|---|---|---|---|---|---|---|---|
2.381 ± 0.489 | 5.556 ± 0.743 |
5.489 ± 0.508 | 4.233 ± 0.724 |
7.672 ± 0.925 | 9.193 ± 0.803 |
5.291 ± 0.541 | 6.415 ± 0.71 |
1.521 ± 0.106 | 4.101 ± 0.595 |
Most of the basic statistics you can see at this page can be downloaded from this CSV file
Proteome-pI is available under Creative Commons Attribution-NoDerivs license, for more details see here
| Reference: Kozlowski LP. Proteome-pI 2.0: Proteome Isoelectric Point Database Update. Nucleic Acids Res. 2021, doi: 10.1093/nar/gkab944 | Contact: Lukasz P. Kozlowski |
