Oxalobacter formigenes OXCC13
Taxonomy: cellular organisms; Bacteria; Proteobacteria; Betaproteobacteria; Burkholderiales; Oxalobacteraceae; Oxalobacter; Oxalobacter formigenes
Average proteome isoelectric point is 6.45
Get precalculated fractions of proteins

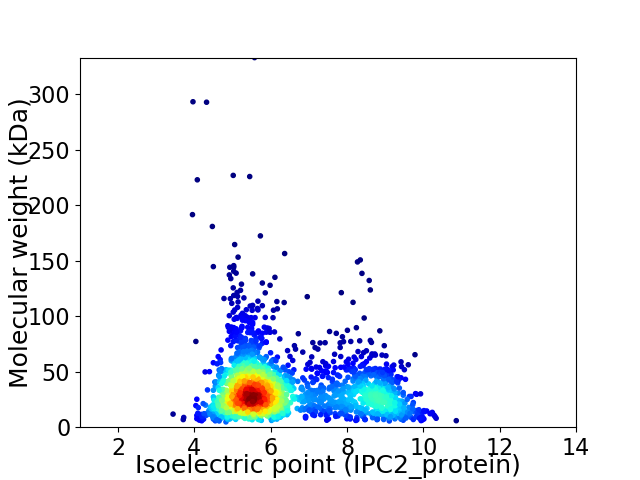
Virtual 2D-PAGE plot for 2076 proteins (isoelectric point calculated using IPC2_protein)
Get csv file with sequences according to given criteria:
* You can choose from 21 different methods for calculating isoelectric point
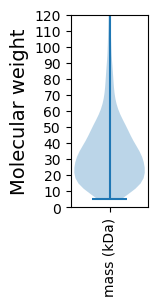
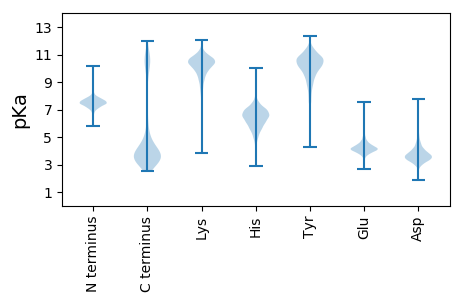
Summary statistics related to proteome-wise predictions


Protein with the lowest isoelectric point:
>tr|C3X8R3|C3X8R3_OXAFO Phage Tail Collar Domain protein OS=Oxalobacter formigenes OXCC13 OX=556269 GN=OFBG_00617 PE=4 SV=1
MM1 pKa = 7.21KK2 pKa = 9.55TDD4 pKa = 4.55KK5 pKa = 11.1DD6 pKa = 3.61IEE8 pKa = 4.39KK9 pKa = 10.69NDD11 pKa = 3.7ADD13 pKa = 4.24DD14 pKa = 4.74TGICLNYY21 pKa = 9.57IDD23 pKa = 5.81NEE25 pKa = 4.09ADD27 pKa = 3.66DD28 pKa = 4.57PTFEE32 pKa = 5.35LNTTGRR38 pKa = 11.84SMNHH42 pKa = 6.75LDD44 pKa = 3.99AQCEE48 pKa = 4.11PDD50 pKa = 4.17PFTPPSMEE58 pKa = 3.38AVAYY62 pKa = 9.44QDD64 pKa = 3.51PLGDD68 pKa = 3.83VEE70 pKa = 5.89LGDD73 pKa = 3.96MDD75 pKa = 4.49DD76 pKa = 4.16TGICMGYY83 pKa = 9.53IDD85 pKa = 5.89PDD87 pKa = 3.35IDD89 pKa = 4.34DD90 pKa = 4.4PTSEE94 pKa = 3.95VDD96 pKa = 3.34MSGSEE101 pKa = 4.34VNRR104 pKa = 11.84LYY106 pKa = 11.27NN107 pKa = 3.52
MM1 pKa = 7.21KK2 pKa = 9.55TDD4 pKa = 4.55KK5 pKa = 11.1DD6 pKa = 3.61IEE8 pKa = 4.39KK9 pKa = 10.69NDD11 pKa = 3.7ADD13 pKa = 4.24DD14 pKa = 4.74TGICLNYY21 pKa = 9.57IDD23 pKa = 5.81NEE25 pKa = 4.09ADD27 pKa = 3.66DD28 pKa = 4.57PTFEE32 pKa = 5.35LNTTGRR38 pKa = 11.84SMNHH42 pKa = 6.75LDD44 pKa = 3.99AQCEE48 pKa = 4.11PDD50 pKa = 4.17PFTPPSMEE58 pKa = 3.38AVAYY62 pKa = 9.44QDD64 pKa = 3.51PLGDD68 pKa = 3.83VEE70 pKa = 5.89LGDD73 pKa = 3.96MDD75 pKa = 4.49DD76 pKa = 4.16TGICMGYY83 pKa = 9.53IDD85 pKa = 5.89PDD87 pKa = 3.35IDD89 pKa = 4.34DD90 pKa = 4.4PTSEE94 pKa = 3.95VDD96 pKa = 3.34MSGSEE101 pKa = 4.34VNRR104 pKa = 11.84LYY106 pKa = 11.27NN107 pKa = 3.52
Molecular weight: 11.82 kDa
Isoelectric point according different methods:
Protein with the highest isoelectric point:
>tr|C3X786|C3X786_OXAFO Probable cytosol aminopeptidase OS=Oxalobacter formigenes OXCC13 OX=556269 GN=pepA PE=3 SV=1
MM1 pKa = 6.88CQSRR5 pKa = 11.84GVFVQDD11 pKa = 4.34YY12 pKa = 10.16NCHH15 pKa = 5.97TPPKK19 pKa = 8.99LTDD22 pKa = 3.18RR23 pKa = 11.84RR24 pKa = 11.84IQMDD28 pKa = 3.14AQTRR32 pKa = 11.84RR33 pKa = 11.84RR34 pKa = 11.84EE35 pKa = 3.77RR36 pKa = 11.84RR37 pKa = 11.84AEE39 pKa = 4.15KK40 pKa = 9.26QAQWKK45 pKa = 8.58AANPLLVGVSAKK57 pKa = 9.96PVNRR61 pKa = 11.84PILSLNRR68 pKa = 11.84KK69 pKa = 7.08PKK71 pKa = 10.54SRR73 pKa = 11.84VEE75 pKa = 4.08SALNPIDD82 pKa = 3.85LTVLAEE88 pKa = 3.79YY89 pKa = 10.18HH90 pKa = 6.13KK91 pKa = 10.76QIEE94 pKa = 4.72SNLQRR99 pKa = 11.84IEE101 pKa = 4.31RR102 pKa = 11.84KK103 pKa = 7.93NQRR106 pKa = 11.84TWYY109 pKa = 9.3SKK111 pKa = 9.58PGEE114 pKa = 4.07RR115 pKa = 11.84GITCSGRR122 pKa = 11.84QQ123 pKa = 3.11
MM1 pKa = 6.88CQSRR5 pKa = 11.84GVFVQDD11 pKa = 4.34YY12 pKa = 10.16NCHH15 pKa = 5.97TPPKK19 pKa = 8.99LTDD22 pKa = 3.18RR23 pKa = 11.84RR24 pKa = 11.84IQMDD28 pKa = 3.14AQTRR32 pKa = 11.84RR33 pKa = 11.84RR34 pKa = 11.84EE35 pKa = 3.77RR36 pKa = 11.84RR37 pKa = 11.84AEE39 pKa = 4.15KK40 pKa = 9.26QAQWKK45 pKa = 8.58AANPLLVGVSAKK57 pKa = 9.96PVNRR61 pKa = 11.84PILSLNRR68 pKa = 11.84KK69 pKa = 7.08PKK71 pKa = 10.54SRR73 pKa = 11.84VEE75 pKa = 4.08SALNPIDD82 pKa = 3.85LTVLAEE88 pKa = 3.79YY89 pKa = 10.18HH90 pKa = 6.13KK91 pKa = 10.76QIEE94 pKa = 4.72SNLQRR99 pKa = 11.84IEE101 pKa = 4.31RR102 pKa = 11.84KK103 pKa = 7.93NQRR106 pKa = 11.84TWYY109 pKa = 9.3SKK111 pKa = 9.58PGEE114 pKa = 4.07RR115 pKa = 11.84GITCSGRR122 pKa = 11.84QQ123 pKa = 3.11
Molecular weight: 14.3 kDa
Isoelectric point according different methods:
Peptides (in silico digests for buttom-up proteomics)
Below you can find in silico digests of the whole proteome with Trypsin, Chymotrypsin, Trypsin+LysC, LysN, ArgC proteases suitable for different mass spec machines.| Try ESI |
 |
|---|
| ChTry ESI |
 |
|---|
| ArgC ESI |
 |
|---|
| LysN ESI |
 |
|---|
| TryLysC ESI |
 |
|---|
| Try MALDI |
 |
|---|
| ChTry MALDI |
 |
|---|
| ArgC MALDI |
 |
|---|
| LysN MALDI |
 |
|---|
| TryLysC MALDI |
 |
|---|
| Try LTQ |
 |
|---|
| ChTry LTQ |
 |
|---|
| ArgC LTQ |
 |
|---|
| LysN LTQ |
 |
|---|
| TryLysC LTQ |
 |
|---|
| Try MSlow |
 |
|---|
| ChTry MSlow |
 |
|---|
| ArgC MSlow |
 |
|---|
| LysN MSlow |
 |
|---|
| TryLysC MSlow |
 |
|---|
| Try MShigh |
 |
|---|
| ChTry MShigh |
 |
|---|
| ArgC MShigh |
 |
|---|
| LysN MShigh |
 |
|---|
| TryLysC MShigh |
 |
|---|
General Statistics
Number of major isoforms |
Number of additional isoforms |
Number of all proteins |
Number of amino acids |
Min. Seq. Length |
Max. Seq. Length |
Avg. Seq. Length |
Avg. Mol. Weight |
|---|---|---|---|---|---|---|---|
0 |
692213 |
44 |
2937 |
333.4 |
36.93 |
Amino acid frequency
Ala |
Cys |
Asp |
Glu |
Phe |
Gly |
His |
Ile |
Lys |
Leu |
|---|---|---|---|---|---|---|---|---|---|
8.888 ± 0.053 | 1.004 ± 0.02 |
5.744 ± 0.047 | 6.254 ± 0.058 |
4.078 ± 0.036 | 7.58 ± 0.091 |
1.979 ± 0.023 | 6.387 ± 0.045 |
5.689 ± 0.056 | 9.545 ± 0.063 |
Met |
Asn |
Gln |
Pro |
Arg |
Ser |
Thr |
Val |
Trp |
Tyr |
|---|---|---|---|---|---|---|---|---|---|
2.852 ± 0.031 | 4.261 ± 0.054 |
4.251 ± 0.039 | 3.547 ± 0.034 |
5.302 ± 0.051 | 6.222 ± 0.045 |
5.385 ± 0.061 | 6.864 ± 0.048 |
1.221 ± 0.019 | 2.95 ± 0.033 |
Most of the basic statistics you can see at this page can be downloaded from this CSV file
Proteome-pI is available under Creative Commons Attribution-NoDerivs license, for more details see here
| Reference: Kozlowski LP. Proteome-pI 2.0: Proteome Isoelectric Point Database Update. Nucleic Acids Res. 2021, doi: 10.1093/nar/gkab944 | Contact: Lukasz P. Kozlowski |
