Lachnospiraceae bacterium XBB2008
Taxonomy: cellular organisms; Bacteria; Terrabacteria group; Firmicutes; Clostridia; Eubacteriales; Lachnospiraceae; unclassified Lachnospiraceae
Average proteome isoelectric point is 5.51
Get precalculated fractions of proteins

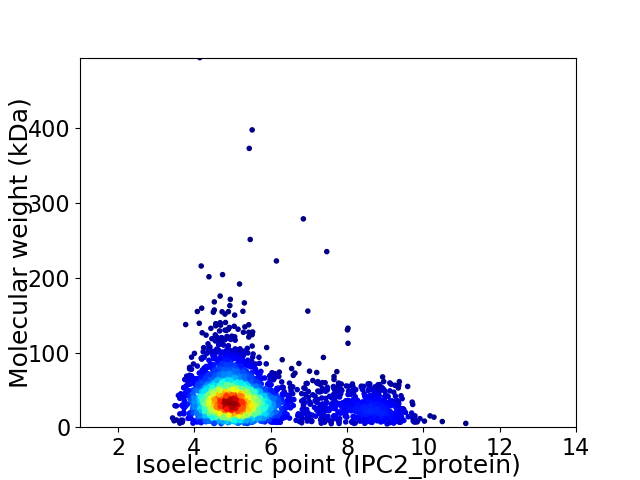
Virtual 2D-PAGE plot for 3048 proteins (isoelectric point calculated using IPC2_protein)
Get csv file with sequences according to given criteria:
* You can choose from 21 different methods for calculating isoelectric point
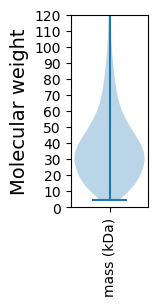
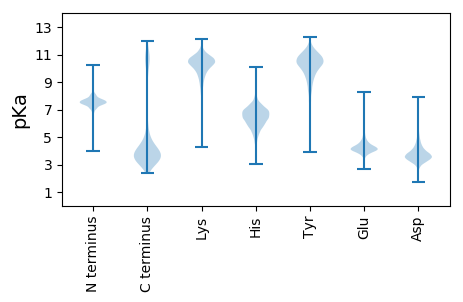
Summary statistics related to proteome-wise predictions


Protein with the lowest isoelectric point:
>tr|A0A1G5AQJ6|A0A1G5AQJ6_9FIRM Diguanylate cyclase (GGDEF) domain-containing protein OS=Lachnospiraceae bacterium XBB2008 OX=1520826 GN=SAMN02910292_00078 PE=4 SV=1
MM1 pKa = 7.71RR2 pKa = 11.84DD3 pKa = 2.9KK4 pKa = 10.99RR5 pKa = 11.84ITVLILTALCTVMLCGCGDD24 pKa = 5.12EE25 pKa = 4.97IPEE28 pKa = 4.29LTPSQQEE35 pKa = 4.16MITEE39 pKa = 4.0YY40 pKa = 10.92SAALLLKK47 pKa = 9.89YY48 pKa = 10.56DD49 pKa = 3.8SNTPSRR55 pKa = 11.84LLPEE59 pKa = 4.42GSVVSIAYY67 pKa = 9.67VDD69 pKa = 4.05PNDD72 pKa = 3.9PNAVLVEE79 pKa = 4.33TTPEE83 pKa = 4.02TEE85 pKa = 4.19TTSDD89 pKa = 3.07IAVDD93 pKa = 3.71NVPDD97 pKa = 3.71VTSEE101 pKa = 4.09DD102 pKa = 3.62VSVTDD107 pKa = 3.28VTTGQTTGGQHH118 pKa = 6.77AGFSNFLADD127 pKa = 4.3LGVSFDD133 pKa = 3.57YY134 pKa = 11.18SGVYY138 pKa = 9.69EE139 pKa = 4.5VVDD142 pKa = 4.44SYY144 pKa = 12.09PEE146 pKa = 4.38GNDD149 pKa = 2.96VNPYY153 pKa = 8.28FTVDD157 pKa = 3.01ATDD160 pKa = 3.6GNKK163 pKa = 10.42LLVIHH168 pKa = 6.87FNLTNNSASDD178 pKa = 3.35MDD180 pKa = 4.45VNLNTLNLRR189 pKa = 11.84YY190 pKa = 9.33RR191 pKa = 11.84VSLNGGKK198 pKa = 9.8NKK200 pKa = 9.8FVMTTLLEE208 pKa = 4.09NDD210 pKa = 2.91ILSYY214 pKa = 11.12VGTLGSGQTEE224 pKa = 4.79DD225 pKa = 3.24IVAICEE231 pKa = 3.63ISEE234 pKa = 4.25AEE236 pKa = 4.09GANIQTIDD244 pKa = 3.42FTVRR248 pKa = 11.84GDD250 pKa = 3.64GFSDD254 pKa = 3.8VMSLQQ259 pKa = 3.25
MM1 pKa = 7.71RR2 pKa = 11.84DD3 pKa = 2.9KK4 pKa = 10.99RR5 pKa = 11.84ITVLILTALCTVMLCGCGDD24 pKa = 5.12EE25 pKa = 4.97IPEE28 pKa = 4.29LTPSQQEE35 pKa = 4.16MITEE39 pKa = 4.0YY40 pKa = 10.92SAALLLKK47 pKa = 9.89YY48 pKa = 10.56DD49 pKa = 3.8SNTPSRR55 pKa = 11.84LLPEE59 pKa = 4.42GSVVSIAYY67 pKa = 9.67VDD69 pKa = 4.05PNDD72 pKa = 3.9PNAVLVEE79 pKa = 4.33TTPEE83 pKa = 4.02TEE85 pKa = 4.19TTSDD89 pKa = 3.07IAVDD93 pKa = 3.71NVPDD97 pKa = 3.71VTSEE101 pKa = 4.09DD102 pKa = 3.62VSVTDD107 pKa = 3.28VTTGQTTGGQHH118 pKa = 6.77AGFSNFLADD127 pKa = 4.3LGVSFDD133 pKa = 3.57YY134 pKa = 11.18SGVYY138 pKa = 9.69EE139 pKa = 4.5VVDD142 pKa = 4.44SYY144 pKa = 12.09PEE146 pKa = 4.38GNDD149 pKa = 2.96VNPYY153 pKa = 8.28FTVDD157 pKa = 3.01ATDD160 pKa = 3.6GNKK163 pKa = 10.42LLVIHH168 pKa = 6.87FNLTNNSASDD178 pKa = 3.35MDD180 pKa = 4.45VNLNTLNLRR189 pKa = 11.84YY190 pKa = 9.33RR191 pKa = 11.84VSLNGGKK198 pKa = 9.8NKK200 pKa = 9.8FVMTTLLEE208 pKa = 4.09NDD210 pKa = 2.91ILSYY214 pKa = 11.12VGTLGSGQTEE224 pKa = 4.79DD225 pKa = 3.24IVAICEE231 pKa = 3.63ISEE234 pKa = 4.25AEE236 pKa = 4.09GANIQTIDD244 pKa = 3.42FTVRR248 pKa = 11.84GDD250 pKa = 3.64GFSDD254 pKa = 3.8VMSLQQ259 pKa = 3.25
Molecular weight: 27.89 kDa
Isoelectric point according different methods:
Protein with the highest isoelectric point:
>tr|A0A1G5EH67|A0A1G5EH67_9FIRM Uncharacterized protein OS=Lachnospiraceae bacterium XBB2008 OX=1520826 GN=SAMN02910292_01236 PE=4 SV=1
MM1 pKa = 7.67KK2 pKa = 8.72MTFQPKK8 pKa = 8.93KK9 pKa = 7.56RR10 pKa = 11.84QRR12 pKa = 11.84NKK14 pKa = 8.03VHH16 pKa = 6.53GFRR19 pKa = 11.84SRR21 pKa = 11.84MSTAGGRR28 pKa = 11.84KK29 pKa = 8.72VLASRR34 pKa = 11.84RR35 pKa = 11.84AKK37 pKa = 10.16GRR39 pKa = 11.84HH40 pKa = 5.42KK41 pKa = 10.58LTVV44 pKa = 3.06
MM1 pKa = 7.67KK2 pKa = 8.72MTFQPKK8 pKa = 8.93KK9 pKa = 7.56RR10 pKa = 11.84QRR12 pKa = 11.84NKK14 pKa = 8.03VHH16 pKa = 6.53GFRR19 pKa = 11.84SRR21 pKa = 11.84MSTAGGRR28 pKa = 11.84KK29 pKa = 8.72VLASRR34 pKa = 11.84RR35 pKa = 11.84AKK37 pKa = 10.16GRR39 pKa = 11.84HH40 pKa = 5.42KK41 pKa = 10.58LTVV44 pKa = 3.06
Molecular weight: 5.12 kDa
Isoelectric point according different methods:
Peptides (in silico digests for buttom-up proteomics)
Below you can find in silico digests of the whole proteome with Trypsin, Chymotrypsin, Trypsin+LysC, LysN, ArgC proteases suitable for different mass spec machines.| Try ESI |
 |
|---|
| ChTry ESI |
 |
|---|
| ArgC ESI |
 |
|---|
| LysN ESI |
 |
|---|
| TryLysC ESI |
 |
|---|
| Try MALDI |
 |
|---|
| ChTry MALDI |
 |
|---|
| ArgC MALDI |
 |
|---|
| LysN MALDI |
 |
|---|
| TryLysC MALDI |
 |
|---|
| Try LTQ |
 |
|---|
| ChTry LTQ |
 |
|---|
| ArgC LTQ |
 |
|---|
| LysN LTQ |
 |
|---|
| TryLysC LTQ |
 |
|---|
| Try MSlow |
 |
|---|
| ChTry MSlow |
 |
|---|
| ArgC MSlow |
 |
|---|
| LysN MSlow |
 |
|---|
| TryLysC MSlow |
 |
|---|
| Try MShigh |
 |
|---|
| ChTry MShigh |
 |
|---|
| ArgC MShigh |
 |
|---|
| LysN MShigh |
 |
|---|
| TryLysC MShigh |
 |
|---|
General Statistics
Number of major isoforms |
Number of additional isoforms |
Number of all proteins |
Number of amino acids |
Min. Seq. Length |
Max. Seq. Length |
Avg. Seq. Length |
Avg. Mol. Weight |
|---|---|---|---|---|---|---|---|
0 |
1097907 |
40 |
4505 |
360.2 |
40.36 |
Amino acid frequency
Ala |
Cys |
Asp |
Glu |
Phe |
Gly |
His |
Ile |
Lys |
Leu |
|---|---|---|---|---|---|---|---|---|---|
7.569 ± 0.046 | 1.408 ± 0.017 |
7.021 ± 0.039 | 7.334 ± 0.046 |
4.065 ± 0.031 | 7.044 ± 0.041 |
1.77 ± 0.018 | 7.683 ± 0.041 |
5.782 ± 0.044 | 8.526 ± 0.042 |
Met |
Asn |
Gln |
Pro |
Arg |
Ser |
Thr |
Val |
Trp |
Tyr |
|---|---|---|---|---|---|---|---|---|---|
3.124 ± 0.021 | 4.202 ± 0.034 |
3.41 ± 0.032 | 2.452 ± 0.021 |
4.764 ± 0.034 | 6.27 ± 0.032 |
5.457 ± 0.039 | 6.756 ± 0.035 |
0.921 ± 0.015 | 4.441 ± 0.03 |
Most of the basic statistics you can see at this page can be downloaded from this CSV file
Proteome-pI is available under Creative Commons Attribution-NoDerivs license, for more details see here
| Reference: Kozlowski LP. Proteome-pI 2.0: Proteome Isoelectric Point Database Update. Nucleic Acids Res. 2021, doi: 10.1093/nar/gkab944 | Contact: Lukasz P. Kozlowski |
