Mesorhizobium sp. WSM3876
Taxonomy: cellular organisms; Bacteria; Proteobacteria; Alphaproteobacteria; Hyphomicrobiales; Phyllobacteriaceae; Mesorhizobium; unclassified Mesorhizobium
Average proteome isoelectric point is 6.67
Get precalculated fractions of proteins

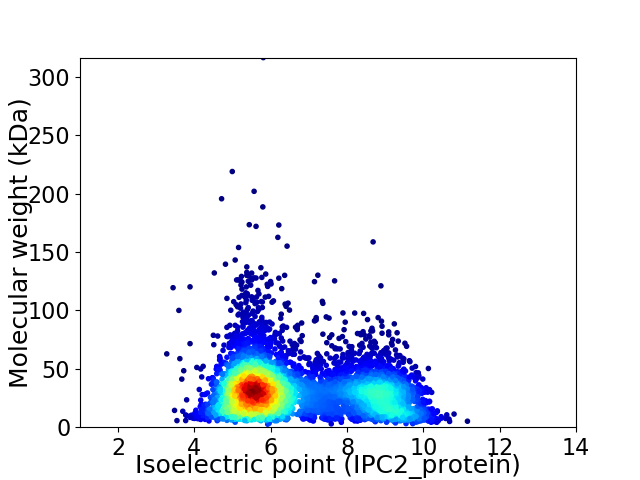
Virtual 2D-PAGE plot for 5672 proteins (isoelectric point calculated using IPC2_protein)
Get csv file with sequences according to given criteria:
* You can choose from 21 different methods for calculating isoelectric point
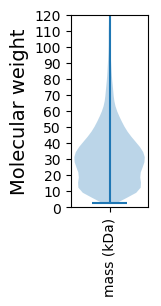
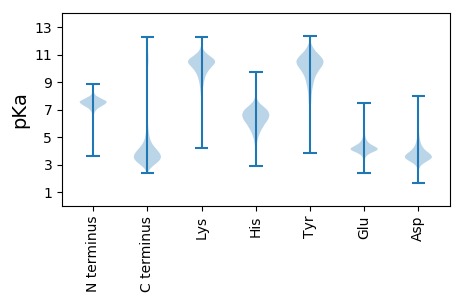
Summary statistics related to proteome-wise predictions


Protein with the lowest isoelectric point:
>tr|A0A2A3C3P5|A0A2A3C3P5_9RHIZ Uncharacterized protein OS=Mesorhizobium sp. WSM3876 OX=422277 GN=CK216_28080 PE=4 SV=1
MM1 pKa = 7.41ATTTISGAGGTTTSFSNTPQAQGDD25 pKa = 4.03VFNYY29 pKa = 10.18TEE31 pKa = 4.6DD32 pKa = 3.3NVVIVNAAQSIILLDD47 pKa = 3.64VMANDD52 pKa = 4.39LGGNAKK58 pKa = 8.36TLFSVDD64 pKa = 3.98DD65 pKa = 5.1GISASTATKK74 pKa = 10.0QYY76 pKa = 11.53APIDD80 pKa = 3.89LTTQDD85 pKa = 3.34VQATGISNWEE95 pKa = 4.24SIGGGVSIRR104 pKa = 11.84INNGKK109 pKa = 9.49VEE111 pKa = 4.22MDD113 pKa = 3.97LSQYY117 pKa = 10.84LLSHH121 pKa = 6.72GFTSLQALGAGDD133 pKa = 4.57NINEE137 pKa = 4.29TFTYY141 pKa = 10.08AIKK144 pKa = 10.66LGNGTLSWASVSVNIQGKK162 pKa = 9.66NDD164 pKa = 3.46GATITAAAAVDD175 pKa = 3.79NTVVEE180 pKa = 4.5AGGVANGTPGDD191 pKa = 4.01PSAHH195 pKa = 5.59GQLIISDD202 pKa = 3.31VDD204 pKa = 3.81LNEE207 pKa = 4.23NHH209 pKa = 6.04FQTPPSLQGTYY220 pKa = 9.3GTFTFDD226 pKa = 3.14ATSGAWTYY234 pKa = 11.9ALNQTLADD242 pKa = 4.61PLTQGQQVTDD252 pKa = 3.6MLQVKK257 pKa = 9.75SADD260 pKa = 3.19GTATYY265 pKa = 10.51NIVVNITGTNDD276 pKa = 3.24AAVVSHH282 pKa = 6.71DD283 pKa = 3.63VRR285 pKa = 11.84NLTEE289 pKa = 4.24GNAAADD295 pKa = 3.49ISTSGTLTISDD306 pKa = 4.02VDD308 pKa = 3.93SDD310 pKa = 3.88PHH312 pKa = 7.06FVAQAGTAGLYY323 pKa = 8.44GTFAIDD329 pKa = 5.21ADD331 pKa = 4.43GAWTYY336 pKa = 8.0TASSAHH342 pKa = 6.81DD343 pKa = 3.62EE344 pKa = 4.53FVAGTTYY351 pKa = 10.86TDD353 pKa = 3.24TFNVVSADD361 pKa = 3.65GTPTTVTINILGTNDD376 pKa = 3.45AAVLSSDD383 pKa = 3.73VKK385 pKa = 11.29NLTEE389 pKa = 3.96TNAAADD395 pKa = 3.47ISTSGTLL402 pKa = 3.33
MM1 pKa = 7.41ATTTISGAGGTTTSFSNTPQAQGDD25 pKa = 4.03VFNYY29 pKa = 10.18TEE31 pKa = 4.6DD32 pKa = 3.3NVVIVNAAQSIILLDD47 pKa = 3.64VMANDD52 pKa = 4.39LGGNAKK58 pKa = 8.36TLFSVDD64 pKa = 3.98DD65 pKa = 5.1GISASTATKK74 pKa = 10.0QYY76 pKa = 11.53APIDD80 pKa = 3.89LTTQDD85 pKa = 3.34VQATGISNWEE95 pKa = 4.24SIGGGVSIRR104 pKa = 11.84INNGKK109 pKa = 9.49VEE111 pKa = 4.22MDD113 pKa = 3.97LSQYY117 pKa = 10.84LLSHH121 pKa = 6.72GFTSLQALGAGDD133 pKa = 4.57NINEE137 pKa = 4.29TFTYY141 pKa = 10.08AIKK144 pKa = 10.66LGNGTLSWASVSVNIQGKK162 pKa = 9.66NDD164 pKa = 3.46GATITAAAAVDD175 pKa = 3.79NTVVEE180 pKa = 4.5AGGVANGTPGDD191 pKa = 4.01PSAHH195 pKa = 5.59GQLIISDD202 pKa = 3.31VDD204 pKa = 3.81LNEE207 pKa = 4.23NHH209 pKa = 6.04FQTPPSLQGTYY220 pKa = 9.3GTFTFDD226 pKa = 3.14ATSGAWTYY234 pKa = 11.9ALNQTLADD242 pKa = 4.61PLTQGQQVTDD252 pKa = 3.6MLQVKK257 pKa = 9.75SADD260 pKa = 3.19GTATYY265 pKa = 10.51NIVVNITGTNDD276 pKa = 3.24AAVVSHH282 pKa = 6.71DD283 pKa = 3.63VRR285 pKa = 11.84NLTEE289 pKa = 4.24GNAAADD295 pKa = 3.49ISTSGTLTISDD306 pKa = 4.02VDD308 pKa = 3.93SDD310 pKa = 3.88PHH312 pKa = 7.06FVAQAGTAGLYY323 pKa = 8.44GTFAIDD329 pKa = 5.21ADD331 pKa = 4.43GAWTYY336 pKa = 8.0TASSAHH342 pKa = 6.81DD343 pKa = 3.62EE344 pKa = 4.53FVAGTTYY351 pKa = 10.86TDD353 pKa = 3.24TFNVVSADD361 pKa = 3.65GTPTTVTINILGTNDD376 pKa = 3.45AAVLSSDD383 pKa = 3.73VKK385 pKa = 11.29NLTEE389 pKa = 3.96TNAAADD395 pKa = 3.47ISTSGTLL402 pKa = 3.33
Molecular weight: 41.2 kDa
Isoelectric point according different methods:
Protein with the highest isoelectric point:
>tr|A0A2A3CGI6|A0A2A3CGI6_9RHIZ Uncharacterized protein OS=Mesorhizobium sp. WSM3876 OX=422277 GN=CK216_05975 PE=4 SV=1
MM1 pKa = 7.35KK2 pKa = 9.43RR3 pKa = 11.84TYY5 pKa = 10.27QPSKK9 pKa = 9.73LVRR12 pKa = 11.84KK13 pKa = 9.15RR14 pKa = 11.84RR15 pKa = 11.84HH16 pKa = 4.42GFRR19 pKa = 11.84ARR21 pKa = 11.84MATKK25 pKa = 10.11GGRR28 pKa = 11.84GVVAARR34 pKa = 11.84RR35 pKa = 11.84NRR37 pKa = 11.84GRR39 pKa = 11.84KK40 pKa = 9.03RR41 pKa = 11.84LSAA44 pKa = 4.03
MM1 pKa = 7.35KK2 pKa = 9.43RR3 pKa = 11.84TYY5 pKa = 10.27QPSKK9 pKa = 9.73LVRR12 pKa = 11.84KK13 pKa = 9.15RR14 pKa = 11.84RR15 pKa = 11.84HH16 pKa = 4.42GFRR19 pKa = 11.84ARR21 pKa = 11.84MATKK25 pKa = 10.11GGRR28 pKa = 11.84GVVAARR34 pKa = 11.84RR35 pKa = 11.84NRR37 pKa = 11.84GRR39 pKa = 11.84KK40 pKa = 9.03RR41 pKa = 11.84LSAA44 pKa = 4.03
Molecular weight: 5.12 kDa
Isoelectric point according different methods:
Peptides (in silico digests for buttom-up proteomics)
Below you can find in silico digests of the whole proteome with Trypsin, Chymotrypsin, Trypsin+LysC, LysN, ArgC proteases suitable for different mass spec machines.| Try ESI |
 |
|---|
| ChTry ESI |
 |
|---|
| ArgC ESI |
 |
|---|
| LysN ESI |
 |
|---|
| TryLysC ESI |
 |
|---|
| Try MALDI |
 |
|---|
| ChTry MALDI |
 |
|---|
| ArgC MALDI |
 |
|---|
| LysN MALDI |
 |
|---|
| TryLysC MALDI |
 |
|---|
| Try LTQ |
 |
|---|
| ChTry LTQ |
 |
|---|
| ArgC LTQ |
 |
|---|
| LysN LTQ |
 |
|---|
| TryLysC LTQ |
 |
|---|
| Try MSlow |
 |
|---|
| ChTry MSlow |
 |
|---|
| ArgC MSlow |
 |
|---|
| LysN MSlow |
 |
|---|
| TryLysC MSlow |
 |
|---|
| Try MShigh |
 |
|---|
| ChTry MShigh |
 |
|---|
| ArgC MShigh |
 |
|---|
| LysN MShigh |
 |
|---|
| TryLysC MShigh |
 |
|---|
General Statistics
Number of major isoforms |
Number of additional isoforms |
Number of all proteins |
Number of amino acids |
Min. Seq. Length |
Max. Seq. Length |
Avg. Seq. Length |
Avg. Mol. Weight |
|---|---|---|---|---|---|---|---|
0 |
1736559 |
26 |
2860 |
306.2 |
33.23 |
Amino acid frequency
Ala |
Cys |
Asp |
Glu |
Phe |
Gly |
His |
Ile |
Lys |
Leu |
|---|---|---|---|---|---|---|---|---|---|
12.536 ± 0.041 | 0.847 ± 0.01 |
5.62 ± 0.024 | 5.674 ± 0.028 |
3.842 ± 0.021 | 8.542 ± 0.032 |
2.044 ± 0.015 | 5.35 ± 0.021 |
3.717 ± 0.027 | 9.949 ± 0.039 |
Met |
Asn |
Gln |
Pro |
Arg |
Ser |
Thr |
Val |
Trp |
Tyr |
|---|---|---|---|---|---|---|---|---|---|
2.503 ± 0.015 | 2.674 ± 0.017 |
5.041 ± 0.024 | 3.068 ± 0.018 |
6.934 ± 0.035 | 5.607 ± 0.023 |
5.08 ± 0.023 | 7.404 ± 0.025 |
1.33 ± 0.013 | 2.24 ± 0.018 |
Most of the basic statistics you can see at this page can be downloaded from this CSV file
Proteome-pI is available under Creative Commons Attribution-NoDerivs license, for more details see here
| Reference: Kozlowski LP. Proteome-pI 2.0: Proteome Isoelectric Point Database Update. Nucleic Acids Res. 2021, doi: 10.1093/nar/gkab944 | Contact: Lukasz P. Kozlowski |
