Ruegeria lacuscaerulensis (strain DSM 11314 / KCTC 2953 / ITI-1157) (Silicibacter lacuscaerulensis)
Taxonomy: cellular organisms; Bacteria; Proteobacteria; Alphaproteobacteria; Rhodobacterales; Roseobacteraceae; Ruegeria; Ruegeria lacuscaerulensis
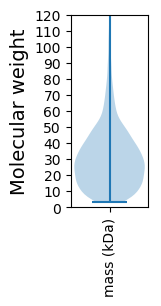
Average proteome isoelectric point is 6.28
Get precalculated fractions of proteins

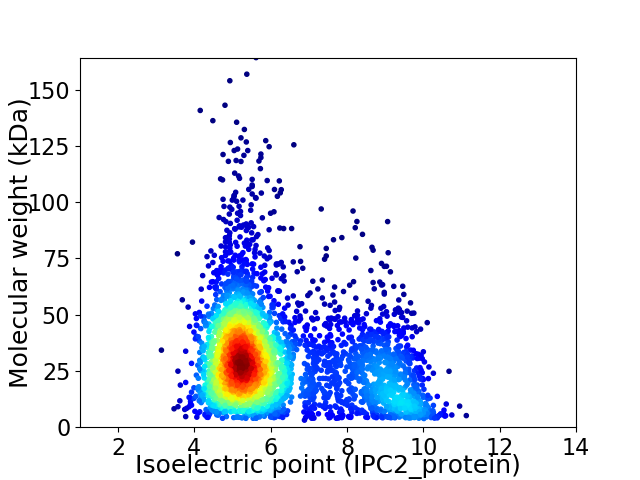
Virtual 2D-PAGE plot for 3603 proteins (isoelectric point calculated using IPC2_protein)
Get csv file with sequences according to given criteria:
* You can choose from 21 different methods for calculating isoelectric point
Summary statistics related to proteome-wise predictions


Protein with the lowest isoelectric point:
>tr|D0CU85|D0CU85_RUELI Pyridoxal phosphate homeostasis protein OS=Ruegeria lacuscaerulensis (strain DSM 11314 / KCTC 2953 / ITI-1157) OX=644107 GN=SL1157_1447 PE=3 SV=1
MM1 pKa = 7.45KK2 pKa = 10.22KK3 pKa = 10.39VLFASTALIATASVAAAEE21 pKa = 4.58VKK23 pKa = 10.4FGGYY27 pKa = 9.98GRR29 pKa = 11.84FGLGYY34 pKa = 10.36LEE36 pKa = 5.0DD37 pKa = 3.86RR38 pKa = 11.84AVTTTTASGATNKK51 pKa = 9.62IAADD55 pKa = 3.52EE56 pKa = 4.69TILVSRR62 pKa = 11.84FRR64 pKa = 11.84LNIDD68 pKa = 4.62GIAEE72 pKa = 3.97TDD74 pKa = 3.14GGVRR78 pKa = 11.84FEE80 pKa = 4.34ARR82 pKa = 11.84VRR84 pKa = 11.84LQADD88 pKa = 3.48EE89 pKa = 4.5DD90 pKa = 4.47ASTGEE95 pKa = 4.07ANAAGLNGARR105 pKa = 11.84FSVIYY110 pKa = 10.46GGLRR114 pKa = 11.84VDD116 pKa = 4.02AGNVAGAFDD125 pKa = 4.34NLAGYY130 pKa = 9.35YY131 pKa = 10.42GNEE134 pKa = 4.03PGLEE138 pKa = 4.13TFIGQYY144 pKa = 10.54SGVDD148 pKa = 3.67YY149 pKa = 11.39DD150 pKa = 4.32FLAYY154 pKa = 10.4DD155 pKa = 3.79STGSGANAVFFQYY168 pKa = 11.24AVGDD172 pKa = 3.88FAFGASYY179 pKa = 10.63DD180 pKa = 3.74QNTTYY185 pKa = 11.21AAGVATDD192 pKa = 3.59ADD194 pKa = 3.8RR195 pKa = 11.84WDD197 pKa = 3.28ISATYY202 pKa = 9.72TFGNITAALAYY213 pKa = 9.58GQTDD217 pKa = 3.71GGAGSDD223 pKa = 3.56PSLTVLTLGGEE234 pKa = 4.34FGDD237 pKa = 4.09LSGTLFVADD246 pKa = 4.88DD247 pKa = 3.97ATEE250 pKa = 3.99VAATDD255 pKa = 3.53GTAYY259 pKa = 10.44GLSLAYY265 pKa = 10.47NLGAATTLTFAYY277 pKa = 10.15GDD279 pKa = 3.76GSADD283 pKa = 4.06EE284 pKa = 4.72DD285 pKa = 4.06TQNYY289 pKa = 9.51GIGAIYY295 pKa = 10.27DD296 pKa = 3.84LGGGASLRR304 pKa = 11.84GGIGVSDD311 pKa = 4.81CDD313 pKa = 3.56VCADD317 pKa = 3.43STLRR321 pKa = 11.84ADD323 pKa = 5.63FGAQFNFF330 pKa = 3.8
MM1 pKa = 7.45KK2 pKa = 10.22KK3 pKa = 10.39VLFASTALIATASVAAAEE21 pKa = 4.58VKK23 pKa = 10.4FGGYY27 pKa = 9.98GRR29 pKa = 11.84FGLGYY34 pKa = 10.36LEE36 pKa = 5.0DD37 pKa = 3.86RR38 pKa = 11.84AVTTTTASGATNKK51 pKa = 9.62IAADD55 pKa = 3.52EE56 pKa = 4.69TILVSRR62 pKa = 11.84FRR64 pKa = 11.84LNIDD68 pKa = 4.62GIAEE72 pKa = 3.97TDD74 pKa = 3.14GGVRR78 pKa = 11.84FEE80 pKa = 4.34ARR82 pKa = 11.84VRR84 pKa = 11.84LQADD88 pKa = 3.48EE89 pKa = 4.5DD90 pKa = 4.47ASTGEE95 pKa = 4.07ANAAGLNGARR105 pKa = 11.84FSVIYY110 pKa = 10.46GGLRR114 pKa = 11.84VDD116 pKa = 4.02AGNVAGAFDD125 pKa = 4.34NLAGYY130 pKa = 9.35YY131 pKa = 10.42GNEE134 pKa = 4.03PGLEE138 pKa = 4.13TFIGQYY144 pKa = 10.54SGVDD148 pKa = 3.67YY149 pKa = 11.39DD150 pKa = 4.32FLAYY154 pKa = 10.4DD155 pKa = 3.79STGSGANAVFFQYY168 pKa = 11.24AVGDD172 pKa = 3.88FAFGASYY179 pKa = 10.63DD180 pKa = 3.74QNTTYY185 pKa = 11.21AAGVATDD192 pKa = 3.59ADD194 pKa = 3.8RR195 pKa = 11.84WDD197 pKa = 3.28ISATYY202 pKa = 9.72TFGNITAALAYY213 pKa = 9.58GQTDD217 pKa = 3.71GGAGSDD223 pKa = 3.56PSLTVLTLGGEE234 pKa = 4.34FGDD237 pKa = 4.09LSGTLFVADD246 pKa = 4.88DD247 pKa = 3.97ATEE250 pKa = 3.99VAATDD255 pKa = 3.53GTAYY259 pKa = 10.44GLSLAYY265 pKa = 10.47NLGAATTLTFAYY277 pKa = 10.15GDD279 pKa = 3.76GSADD283 pKa = 4.06EE284 pKa = 4.72DD285 pKa = 4.06TQNYY289 pKa = 9.51GIGAIYY295 pKa = 10.27DD296 pKa = 3.84LGGGASLRR304 pKa = 11.84GGIGVSDD311 pKa = 4.81CDD313 pKa = 3.56VCADD317 pKa = 3.43STLRR321 pKa = 11.84ADD323 pKa = 5.63FGAQFNFF330 pKa = 3.8
Molecular weight: 33.78 kDa
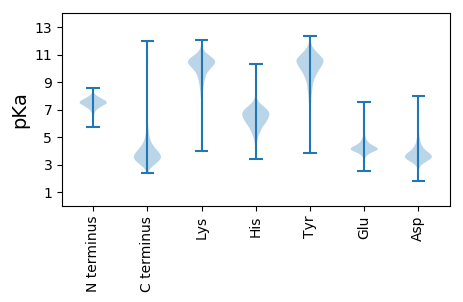
Isoelectric point according different methods:
Protein with the highest isoelectric point:
>tr|D0CSX3|D0CSX3_RUELI Glycosyl transferase group 2 family OS=Ruegeria lacuscaerulensis (strain DSM 11314 / KCTC 2953 / ITI-1157) OX=644107 GN=SL1157_3246 PE=4 SV=1
MM1 pKa = 6.98TPKK4 pKa = 9.43TGRR7 pKa = 11.84WAALKK12 pKa = 10.34AQLRR16 pKa = 11.84PALARR21 pKa = 11.84IRR23 pKa = 11.84QKK25 pKa = 10.58VPRR28 pKa = 11.84GLRR31 pKa = 11.84FVVGILLIIGGIFGFLPVVGFWMIPLGIMVAAMDD65 pKa = 3.5VQLFVRR71 pKa = 11.84WLRR74 pKa = 11.84KK75 pKa = 9.06RR76 pKa = 11.84RR77 pKa = 11.84QGPRR81 pKa = 11.84RR82 pKa = 3.51
MM1 pKa = 6.98TPKK4 pKa = 9.43TGRR7 pKa = 11.84WAALKK12 pKa = 10.34AQLRR16 pKa = 11.84PALARR21 pKa = 11.84IRR23 pKa = 11.84QKK25 pKa = 10.58VPRR28 pKa = 11.84GLRR31 pKa = 11.84FVVGILLIIGGIFGFLPVVGFWMIPLGIMVAAMDD65 pKa = 3.5VQLFVRR71 pKa = 11.84WLRR74 pKa = 11.84KK75 pKa = 9.06RR76 pKa = 11.84RR77 pKa = 11.84QGPRR81 pKa = 11.84RR82 pKa = 3.51
Molecular weight: 9.36 kDa
Isoelectric point according different methods:
Peptides (in silico digests for buttom-up proteomics)
Below you can find in silico digests of the whole proteome with Trypsin, Chymotrypsin, Trypsin+LysC, LysN, ArgC proteases suitable for different mass spec machines.| Try ESI |
 |
|---|
| ChTry ESI |
 |
|---|
| ArgC ESI |
 |
|---|
| LysN ESI |
 |
|---|
| TryLysC ESI |
 |
|---|
| Try MALDI |
 |
|---|
| ChTry MALDI |
 |
|---|
| ArgC MALDI |
 |
|---|
| LysN MALDI |
 |
|---|
| TryLysC MALDI |
 |
|---|
| Try LTQ |
 |
|---|
| ChTry LTQ |
 |
|---|
| ArgC LTQ |
 |
|---|
| LysN LTQ |
 |
|---|
| TryLysC LTQ |
 |
|---|
| Try MSlow |
 |
|---|
| ChTry MSlow |
 |
|---|
| ArgC MSlow |
 |
|---|
| LysN MSlow |
 |
|---|
| TryLysC MSlow |
 |
|---|
| Try MShigh |
 |
|---|
| ChTry MShigh |
 |
|---|
| ArgC MShigh |
 |
|---|
| LysN MShigh |
 |
|---|
| TryLysC MShigh |
 |
|---|
General Statistics
Number of major isoforms |
Number of additional isoforms |
Number of all proteins |
Number of amino acids |
Min. Seq. Length |
Max. Seq. Length |
Avg. Seq. Length |
Avg. Mol. Weight |
|---|---|---|---|---|---|---|---|
0 |
1059865 |
31 |
1510 |
294.2 |
32.04 |
Amino acid frequency
Ala |
Cys |
Asp |
Glu |
Phe |
Gly |
His |
Ile |
Lys |
Leu |
|---|---|---|---|---|---|---|---|---|---|
11.945 ± 0.053 | 0.948 ± 0.013 |
6.093 ± 0.034 | 5.894 ± 0.039 |
3.735 ± 0.027 | 8.484 ± 0.038 |
2.105 ± 0.022 | 5.157 ± 0.03 |
3.369 ± 0.034 | 9.92 ± 0.053 |
Met |
Asn |
Gln |
Pro |
Arg |
Ser |
Thr |
Val |
Trp |
Tyr |
|---|---|---|---|---|---|---|---|---|---|
2.77 ± 0.018 | 2.655 ± 0.022 |
5.219 ± 0.028 | 3.488 ± 0.023 |
6.84 ± 0.042 | 4.973 ± 0.026 |
5.298 ± 0.028 | 7.275 ± 0.033 |
1.44 ± 0.018 | 2.26 ± 0.022 |
Most of the basic statistics you can see at this page can be downloaded from this CSV file
Proteome-pI is available under Creative Commons Attribution-NoDerivs license, for more details see here
| Reference: Kozlowski LP. Proteome-pI 2.0: Proteome Isoelectric Point Database Update. Nucleic Acids Res. 2021, doi: 10.1093/nar/gkab944 | Contact: Lukasz P. Kozlowski |
