Fusobacterium sp. CAG:815
Taxonomy: cellular organisms; Bacteria; Fusobacteria; Fusobacteriia; Fusobacteriales; Fusobacteriaceae; Fusobacterium; environmental samples
Average proteome isoelectric point is 6.84
Get precalculated fractions of proteins
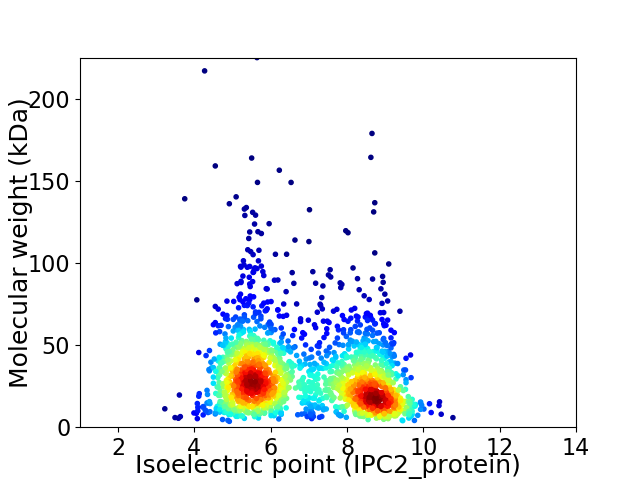
Virtual 2D-PAGE plot for 1820 proteins (isoelectric point calculated using IPC2_protein)
Get csv file with sequences according to given criteria:
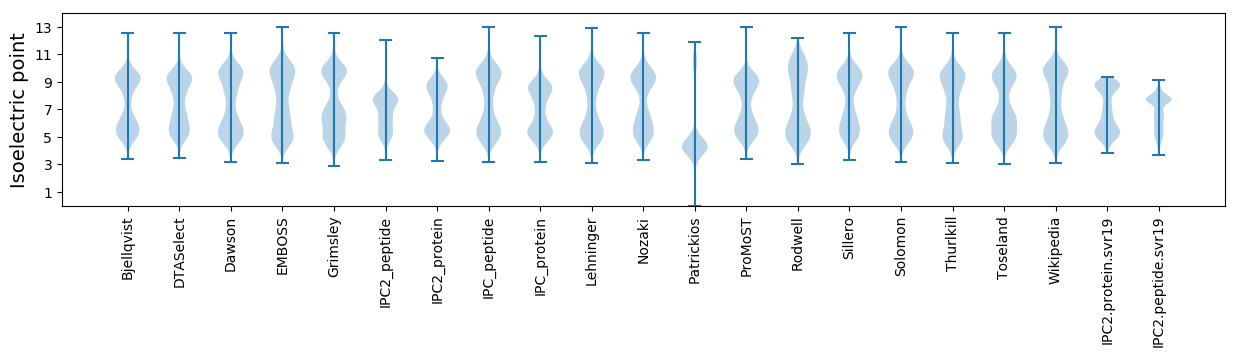
* You can choose from 21 different methods for calculating isoelectric point
Summary statistics related to proteome-wise predictions
Protein with the lowest isoelectric point:
>tr|R7LW28|R7LW28_9FUSO Putative glycosyl/glycerophosphate transferases involved in teichoic acid biosynthesis TagF/TagB/EpsJ/RodC OS=Fusobacterium sp. CAG:815 OX=1262901 GN=BN791_00451 PE=3 SV=1
MM1 pKa = 7.59ILLFDD6 pKa = 4.31SKK8 pKa = 11.08ASKK11 pKa = 9.0STASAKK17 pKa = 10.09SSKK20 pKa = 9.75VRR22 pKa = 11.84NNPVEE27 pKa = 3.92NSGILAMNMNDD38 pKa = 3.3ARR40 pKa = 11.84SLLTMGEE47 pKa = 3.9YY48 pKa = 9.02DD49 pKa = 3.83TYY51 pKa = 11.49VSSNPVAVDD60 pKa = 2.93YY61 pKa = 11.79AMYY64 pKa = 10.69SNSSDD69 pKa = 3.49FSNSDD74 pKa = 3.29SGFMSEE80 pKa = 5.36FSDD83 pKa = 4.84AVATLTDD90 pKa = 3.42GGFGGFGGFSAGADD104 pKa = 3.57CGASCSSGSFASVCC118 pKa = 3.76
MM1 pKa = 7.59ILLFDD6 pKa = 4.31SKK8 pKa = 11.08ASKK11 pKa = 9.0STASAKK17 pKa = 10.09SSKK20 pKa = 9.75VRR22 pKa = 11.84NNPVEE27 pKa = 3.92NSGILAMNMNDD38 pKa = 3.3ARR40 pKa = 11.84SLLTMGEE47 pKa = 3.9YY48 pKa = 9.02DD49 pKa = 3.83TYY51 pKa = 11.49VSSNPVAVDD60 pKa = 2.93YY61 pKa = 11.79AMYY64 pKa = 10.69SNSSDD69 pKa = 3.49FSNSDD74 pKa = 3.29SGFMSEE80 pKa = 5.36FSDD83 pKa = 4.84AVATLTDD90 pKa = 3.42GGFGGFGGFSAGADD104 pKa = 3.57CGASCSSGSFASVCC118 pKa = 3.76
Molecular weight: 12.1 kDa
Isoelectric point according different methods:
Protein with the highest isoelectric point:
>tr|R7M0S6|R7M0S6_9FUSO Cell division protein FtsZ OS=Fusobacterium sp. CAG:815 OX=1262901 GN=ftsZ PE=3 SV=1
MM1 pKa = 7.68RR2 pKa = 11.84RR3 pKa = 11.84TLEE6 pKa = 3.61GTKK9 pKa = 9.97RR10 pKa = 11.84KK11 pKa = 8.92RR12 pKa = 11.84QNVSGFRR19 pKa = 11.84ARR21 pKa = 11.84MSTPGGRR28 pKa = 11.84EE29 pKa = 3.69VINRR33 pKa = 11.84RR34 pKa = 11.84RR35 pKa = 11.84ARR37 pKa = 11.84GRR39 pKa = 11.84HH40 pKa = 5.36KK41 pKa = 10.99LSITAKK47 pKa = 10.1KK48 pKa = 9.93RR49 pKa = 11.84AA50 pKa = 3.48
MM1 pKa = 7.68RR2 pKa = 11.84RR3 pKa = 11.84TLEE6 pKa = 3.61GTKK9 pKa = 9.97RR10 pKa = 11.84KK11 pKa = 8.92RR12 pKa = 11.84QNVSGFRR19 pKa = 11.84ARR21 pKa = 11.84MSTPGGRR28 pKa = 11.84EE29 pKa = 3.69VINRR33 pKa = 11.84RR34 pKa = 11.84RR35 pKa = 11.84ARR37 pKa = 11.84GRR39 pKa = 11.84HH40 pKa = 5.36KK41 pKa = 10.99LSITAKK47 pKa = 10.1KK48 pKa = 9.93RR49 pKa = 11.84AA50 pKa = 3.48
Molecular weight: 5.83 kDa
Isoelectric point according different methods:
Peptides (in silico digests for buttom-up proteomics)
Below you can find in silico digests of the whole proteome with Trypsin, Chymotrypsin, Trypsin+LysC, LysN, ArgC proteases suitable for different mass spec machines.| Try ESI |
 |
|---|
| ChTry ESI |
|
|---|
| ArgC ESI |
|
|---|
| LysN ESI |
|
|---|
| TryLysC ESI |
|
|---|
| Try MALDI |
|
|---|
| ChTry MALDI |
|
|---|
| ArgC MALDI |
|
|---|
| LysN MALDI |
|
|---|
| TryLysC MALDI |
|
|---|
| Try LTQ |
|
|---|
| ChTry LTQ |
|
|---|
| ArgC LTQ |
|
|---|
| LysN LTQ |
|
|---|
| TryLysC LTQ |
|
|---|
| Try MSlow |
|
|---|
| ChTry MSlow |
|
|---|
| ArgC MSlow |
|
|---|
| LysN MSlow |
|
|---|
| TryLysC MSlow |
|
|---|
| Try MShigh |
|
|---|
| ChTry MShigh |
|
|---|
| ArgC MShigh |
|
|---|
| LysN MShigh |
|
|---|
| TryLysC MShigh |
|
|---|
General Statistics
Number of major isoforms |
Number of additional isoforms |
Number of all proteins |
Number of amino acids |
Min. Seq. Length |
Max. Seq. Length |
Avg. Seq. Length |
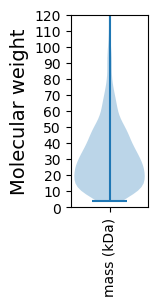
Avg. Mol. Weight |
|---|---|---|---|---|---|---|---|
0 |
548868 |
30 |
1972 |
301.6 |
34.01 |
Amino acid frequency
Ala |
Cys |
Asp |
Glu |
Phe |
Gly |
His |
Ile |
Lys |
Leu |
|---|---|---|---|---|---|---|---|---|---|
6.458 ± 0.063 | 1.247 ± 0.025 |
5.769 ± 0.044 | 6.685 ± 0.07 |
4.504 ± 0.052 | 5.779 ± 0.062 |
1.492 ± 0.019 | 8.383 ± 0.056 |
9.167 ± 0.066 | 8.87 ± 0.061 |
Met |
Asn |
Gln |
Pro |
Arg |
Ser |
Thr |
Val |
Trp |
Tyr |
|---|---|---|---|---|---|---|---|---|---|
2.523 ± 0.029 | 6.372 ± 0.064 |
3.307 ± 0.036 | 3.309 ± 0.037 |
3.355 ± 0.034 | 6.344 ± 0.05 |
5.551 ± 0.042 | 6.228 ± 0.049 |
0.669 ± 0.017 | 3.988 ± 0.051 |
Most of the basic statistics you can see at this page can be downloaded from this CSV file
See this proteome in:

Proteome-pI is available under Creative Commons Attribution-NoDerivs license, for more details see here
| Reference: Kozlowski LP. Proteome-pI 2.0: Proteome Isoelectric Point Database Update. Nucleic Acids Res. 2021, doi: 10.1093/nar/gkab944 | Contact: Lukasz P. Kozlowski |