Bifidobacterium primatium
Taxonomy: cellular organisms; Bacteria; Terrabacteria group; Actinobacteria; Actinomycetia; Bifidobacteriales; Bifidobacteriaceae; Bifidobacterium
Average proteome isoelectric point is 6.07
Get precalculated fractions of proteins

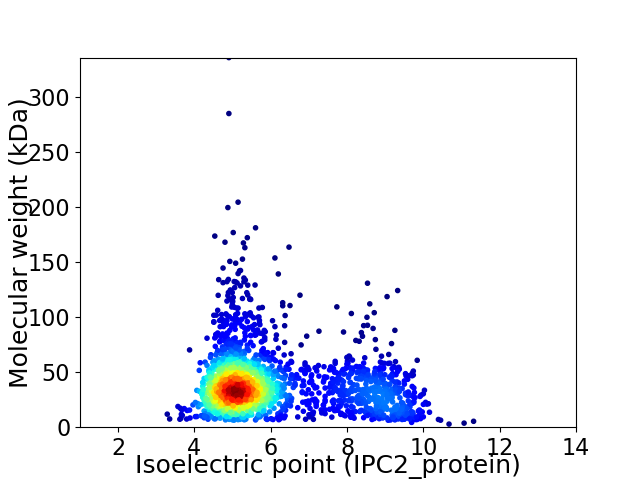
Virtual 2D-PAGE plot for 2029 proteins (isoelectric point calculated using IPC2_protein)
Get csv file with sequences according to given criteria:
* You can choose from 21 different methods for calculating isoelectric point
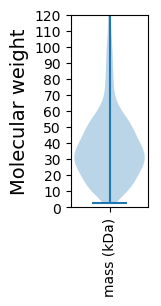
Summary statistics related to proteome-wise predictions


Protein with the lowest isoelectric point:
>tr|A0A2M9HBD6|A0A2M9HBD6_9BIFI Amino acid ABC transporter substrate-binding protein OS=Bifidobacterium primatium OX=2045438 GN=CS006_03055 PE=3 SV=1
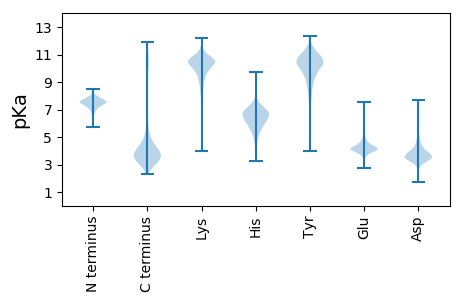
MM1 pKa = 7.52IGGIVALAIIIAVVLAVIGVVGGHH25 pKa = 6.25SDD27 pKa = 3.48DD28 pKa = 3.37STYY31 pKa = 11.63ADD33 pKa = 3.7GQQGYY38 pKa = 10.33DD39 pKa = 3.53SVPFDD44 pKa = 5.49DD45 pKa = 5.66PYY47 pKa = 11.73QMQRR51 pKa = 11.84DD52 pKa = 3.72ISSITGSSCLWSDD65 pKa = 2.92IGSYY69 pKa = 10.19SALGGDD75 pKa = 4.62SEE77 pKa = 4.72ASSIPGLDD85 pKa = 3.29GAYY88 pKa = 8.94TCGDD92 pKa = 3.88DD93 pKa = 5.44EE94 pKa = 4.79ILLMFDD100 pKa = 3.34TTSDD104 pKa = 3.15TRR106 pKa = 11.84QMVTTLEE113 pKa = 4.0RR114 pKa = 11.84SLAQGDD120 pKa = 4.0DD121 pKa = 3.82TFDD124 pKa = 3.47TTVTDD129 pKa = 3.38SLGDD133 pKa = 3.6YY134 pKa = 10.88AVVHH138 pKa = 7.44DD139 pKa = 4.83DD140 pKa = 2.69TWMVIGKK147 pKa = 8.77NADD150 pKa = 3.07MKK152 pKa = 10.64QLHH155 pKa = 6.56DD156 pKa = 3.46AWGGDD161 pKa = 3.49MQRR164 pKa = 11.84LDD166 pKa = 4.0EE167 pKa = 4.76LADD170 pKa = 3.58SGSRR174 pKa = 11.84DD175 pKa = 3.72TII177 pKa = 3.73
MM1 pKa = 7.52IGGIVALAIIIAVVLAVIGVVGGHH25 pKa = 6.25SDD27 pKa = 3.48DD28 pKa = 3.37STYY31 pKa = 11.63ADD33 pKa = 3.7GQQGYY38 pKa = 10.33DD39 pKa = 3.53SVPFDD44 pKa = 5.49DD45 pKa = 5.66PYY47 pKa = 11.73QMQRR51 pKa = 11.84DD52 pKa = 3.72ISSITGSSCLWSDD65 pKa = 2.92IGSYY69 pKa = 10.19SALGGDD75 pKa = 4.62SEE77 pKa = 4.72ASSIPGLDD85 pKa = 3.29GAYY88 pKa = 8.94TCGDD92 pKa = 3.88DD93 pKa = 5.44EE94 pKa = 4.79ILLMFDD100 pKa = 3.34TTSDD104 pKa = 3.15TRR106 pKa = 11.84QMVTTLEE113 pKa = 4.0RR114 pKa = 11.84SLAQGDD120 pKa = 4.0DD121 pKa = 3.82TFDD124 pKa = 3.47TTVTDD129 pKa = 3.38SLGDD133 pKa = 3.6YY134 pKa = 10.88AVVHH138 pKa = 7.44DD139 pKa = 4.83DD140 pKa = 2.69TWMVIGKK147 pKa = 8.77NADD150 pKa = 3.07MKK152 pKa = 10.64QLHH155 pKa = 6.56DD156 pKa = 3.46AWGGDD161 pKa = 3.49MQRR164 pKa = 11.84LDD166 pKa = 4.0EE167 pKa = 4.76LADD170 pKa = 3.58SGSRR174 pKa = 11.84DD175 pKa = 3.72TII177 pKa = 3.73
Molecular weight: 18.8 kDa
Isoelectric point according different methods:
Protein with the highest isoelectric point:
>tr|A0A2M9HBS7|A0A2M9HBS7_9BIFI Non-specific serine/threonine protein kinase OS=Bifidobacterium primatium OX=2045438 GN=CS006_03860 PE=4 SV=1
MM1 pKa = 7.44KK2 pKa = 9.6RR3 pKa = 11.84TFQPNNRR10 pKa = 11.84RR11 pKa = 11.84RR12 pKa = 11.84HH13 pKa = 4.79MKK15 pKa = 9.36HH16 pKa = 5.81GFRR19 pKa = 11.84ARR21 pKa = 11.84MRR23 pKa = 11.84TRR25 pKa = 11.84SGRR28 pKa = 11.84ALINRR33 pKa = 11.84RR34 pKa = 11.84RR35 pKa = 11.84AKK37 pKa = 9.79GRR39 pKa = 11.84KK40 pKa = 8.67VLSAA44 pKa = 4.05
MM1 pKa = 7.44KK2 pKa = 9.6RR3 pKa = 11.84TFQPNNRR10 pKa = 11.84RR11 pKa = 11.84RR12 pKa = 11.84HH13 pKa = 4.79MKK15 pKa = 9.36HH16 pKa = 5.81GFRR19 pKa = 11.84ARR21 pKa = 11.84MRR23 pKa = 11.84TRR25 pKa = 11.84SGRR28 pKa = 11.84ALINRR33 pKa = 11.84RR34 pKa = 11.84RR35 pKa = 11.84AKK37 pKa = 9.79GRR39 pKa = 11.84KK40 pKa = 8.67VLSAA44 pKa = 4.05
Molecular weight: 5.36 kDa
Isoelectric point according different methods:
Peptides (in silico digests for buttom-up proteomics)
Below you can find in silico digests of the whole proteome with Trypsin, Chymotrypsin, Trypsin+LysC, LysN, ArgC proteases suitable for different mass spec machines.| Try ESI |
 |
|---|
| ChTry ESI |
 |
|---|
| ArgC ESI |
 |
|---|
| LysN ESI |
 |
|---|
| TryLysC ESI |
 |
|---|
| Try MALDI |
 |
|---|
| ChTry MALDI |
 |
|---|
| ArgC MALDI |
 |
|---|
| LysN MALDI |
 |
|---|
| TryLysC MALDI |
 |
|---|
| Try LTQ |
 |
|---|
| ChTry LTQ |
 |
|---|
| ArgC LTQ |
 |
|---|
| LysN LTQ |
 |
|---|
| TryLysC LTQ |
 |
|---|
| Try MSlow |
 |
|---|
| ChTry MSlow |
 |
|---|
| ArgC MSlow |
 |
|---|
| LysN MSlow |
 |
|---|
| TryLysC MSlow |
 |
|---|
| Try MShigh |
 |
|---|
| ChTry MShigh |
 |
|---|
| ArgC MShigh |
 |
|---|
| LysN MShigh |
 |
|---|
| TryLysC MShigh |
 |
|---|
General Statistics
Number of major isoforms |
Number of additional isoforms |
Number of all proteins |
Number of amino acids |
Min. Seq. Length |
Max. Seq. Length |
Avg. Seq. Length |
Avg. Mol. Weight |
|---|---|---|---|---|---|---|---|
0 |
759016 |
24 |
3146 |
374.1 |
40.73 |
Amino acid frequency
Ala |
Cys |
Asp |
Glu |
Phe |
Gly |
His |
Ile |
Lys |
Leu |
|---|---|---|---|---|---|---|---|---|---|
11.098 ± 0.082 | 0.876 ± 0.017 |
6.793 ± 0.053 | 5.581 ± 0.055 |
3.468 ± 0.037 | 8.322 ± 0.046 |
2.127 ± 0.026 | 5.314 ± 0.041 |
3.994 ± 0.053 | 8.631 ± 0.056 |
Met |
Asn |
Gln |
Pro |
Arg |
Ser |
Thr |
Val |
Trp |
Tyr |
|---|---|---|---|---|---|---|---|---|---|
2.573 ± 0.025 | 3.294 ± 0.038 |
4.595 ± 0.036 | 3.05 ± 0.03 |
6.155 ± 0.069 | 6.034 ± 0.056 |
6.091 ± 0.049 | 7.914 ± 0.044 |
1.309 ± 0.022 | 2.781 ± 0.03 |
Most of the basic statistics you can see at this page can be downloaded from this CSV file
Proteome-pI is available under Creative Commons Attribution-NoDerivs license, for more details see here
| Reference: Kozlowski LP. Proteome-pI 2.0: Proteome Isoelectric Point Database Update. Nucleic Acids Res. 2021, doi: 10.1093/nar/gkab944 | Contact: Lukasz P. Kozlowski |
