Canine adenovirus serotype 2 (CAdV-2) (Canine adenovirus 2)
Taxonomy: Viruses; Varidnaviria; Bamfordvirae; Preplasmiviricota; Tectiliviricetes; Rowavirales; Adenoviridae; Mastadenovirus; Canine mastadenovirus A
Average proteome isoelectric point is 6.6
Get precalculated fractions of proteins
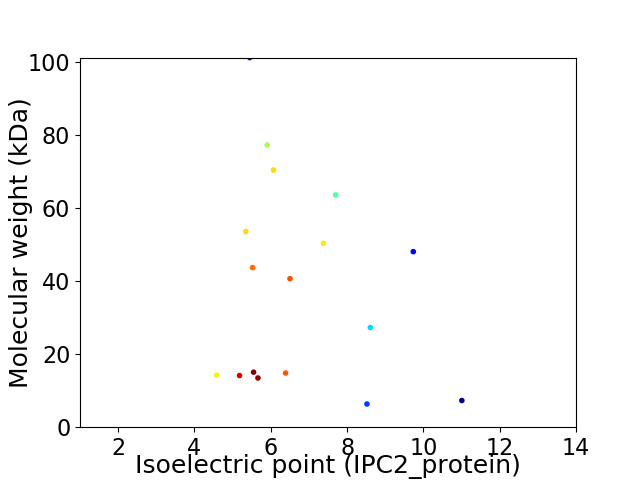
Virtual 2D-PAGE plot for 17 proteins (isoelectric point calculated using IPC2_protein)
Get csv file with sequences according to given criteria:
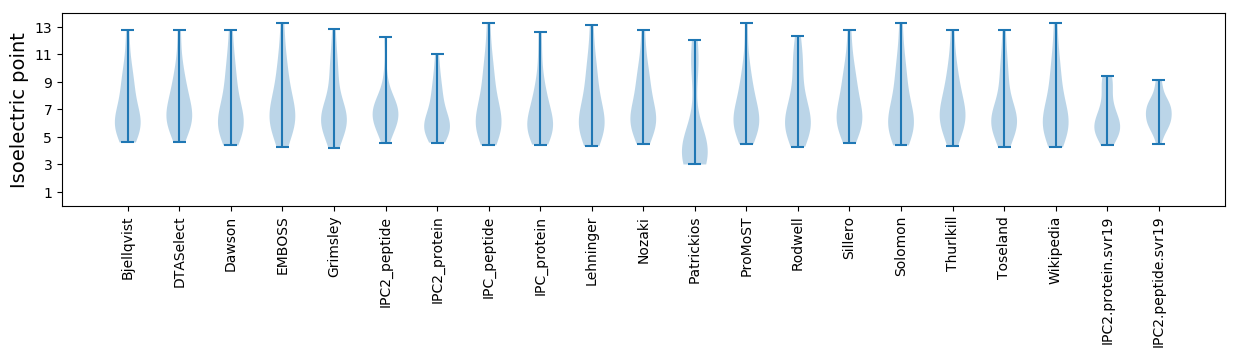
* You can choose from 21 different methods for calculating isoelectric point
Summary statistics related to proteome-wise predictions
Protein with the lowest isoelectric point:
>tr|Q76SA8|Q76SA8_ADEC2 Putative E3 region ORF2 OS=Canine adenovirus serotype 2 OX=10514 PE=4 SV=1
MM1 pKa = 7.47AALGVSMGACFCLRR15 pKa = 11.84LHH17 pKa = 6.58KK18 pKa = 10.81SLVEE22 pKa = 4.16SVCAQLEE29 pKa = 4.39LTDD32 pKa = 4.45FLPSEE37 pKa = 4.18LRR39 pKa = 11.84RR40 pKa = 11.84VVFSLIRR47 pKa = 11.84AQEE50 pKa = 3.92VRR52 pKa = 11.84PCPTFAAAVSVLSGDD67 pKa = 3.54YY68 pKa = 11.26LEE70 pKa = 5.63FYY72 pKa = 10.85LFIGSDD78 pKa = 3.58TEE80 pKa = 4.61GFGSVADD87 pKa = 3.84IQATAVSLQEE97 pKa = 3.52ALRR100 pKa = 11.84RR101 pKa = 11.84DD102 pKa = 4.24FCQLIPEE109 pKa = 4.75DD110 pKa = 4.32CAHH113 pKa = 7.02LALGLSVTWEE123 pKa = 3.86PNILVTAEE131 pKa = 3.71
MM1 pKa = 7.47AALGVSMGACFCLRR15 pKa = 11.84LHH17 pKa = 6.58KK18 pKa = 10.81SLVEE22 pKa = 4.16SVCAQLEE29 pKa = 4.39LTDD32 pKa = 4.45FLPSEE37 pKa = 4.18LRR39 pKa = 11.84RR40 pKa = 11.84VVFSLIRR47 pKa = 11.84AQEE50 pKa = 3.92VRR52 pKa = 11.84PCPTFAAAVSVLSGDD67 pKa = 3.54YY68 pKa = 11.26LEE70 pKa = 5.63FYY72 pKa = 10.85LFIGSDD78 pKa = 3.58TEE80 pKa = 4.61GFGSVADD87 pKa = 3.84IQATAVSLQEE97 pKa = 3.52ALRR100 pKa = 11.84RR101 pKa = 11.84DD102 pKa = 4.24FCQLIPEE109 pKa = 4.75DD110 pKa = 4.32CAHH113 pKa = 7.02LALGLSVTWEE123 pKa = 3.86PNILVTAEE131 pKa = 3.71
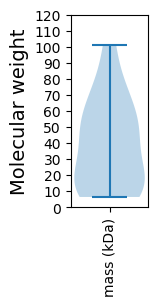
Molecular weight: 14.24 kDa
Isoelectric point according different methods:
Protein with the highest isoelectric point:
>tr|P87562|P87562_ADEC2 Hexon protein OS=Canine adenovirus serotype 2 OX=10514 GN=L3 PE=2 SV=1
MM1 pKa = 7.77AGRR4 pKa = 11.84NVTLRR9 pKa = 11.84LRR11 pKa = 11.84VPVRR15 pKa = 11.84TKK17 pKa = 9.3ITGAGRR23 pKa = 11.84RR24 pKa = 11.84RR25 pKa = 11.84GRR27 pKa = 11.84RR28 pKa = 11.84PRR30 pKa = 11.84GIRR33 pKa = 11.84CGRR36 pKa = 11.84MRR38 pKa = 11.84GGFLPALIPLIAAAIGAVPGIASVALQAARR68 pKa = 11.84HH69 pKa = 4.96
MM1 pKa = 7.77AGRR4 pKa = 11.84NVTLRR9 pKa = 11.84LRR11 pKa = 11.84VPVRR15 pKa = 11.84TKK17 pKa = 9.3ITGAGRR23 pKa = 11.84RR24 pKa = 11.84RR25 pKa = 11.84GRR27 pKa = 11.84RR28 pKa = 11.84PRR30 pKa = 11.84GIRR33 pKa = 11.84CGRR36 pKa = 11.84MRR38 pKa = 11.84GGFLPALIPLIAAAIGAVPGIASVALQAARR68 pKa = 11.84HH69 pKa = 4.96
Molecular weight: 7.31 kDa
Isoelectric point according different methods:
Peptides (in silico digests for buttom-up proteomics)
Below you can find in silico digests of the whole proteome with Trypsin, Chymotrypsin, Trypsin+LysC, LysN, ArgC proteases suitable for different mass spec machines.| Try ESI |
 |
|---|
| ChTry ESI |
|
|---|
| ArgC ESI |
|
|---|
| LysN ESI |
|
|---|
| TryLysC ESI |
|
|---|
| Try MALDI |
|
|---|
| ChTry MALDI |
|
|---|
| ArgC MALDI |
|
|---|
| LysN MALDI |
|
|---|
| TryLysC MALDI |
|
|---|
| Try LTQ |
|
|---|
| ChTry LTQ |
|
|---|
| ArgC LTQ |
|
|---|
| LysN LTQ |
|
|---|
| TryLysC LTQ |
|
|---|
| Try MSlow |
|
|---|
| ChTry MSlow |
|
|---|
| ArgC MSlow |
|
|---|
| LysN MSlow |
|
|---|
| TryLysC MSlow |
|
|---|
| Try MShigh |
|
|---|
| ChTry MShigh |
|
|---|
| ArgC MShigh |
|
|---|
| LysN MShigh |
|
|---|
| TryLysC MShigh |
|
|---|
General Statistics
Number of major isoforms |
Number of additional isoforms |
Number of all proteins |
Number of amino acids |
Min. Seq. Length |
Max. Seq. Length |
Avg. Seq. Length |
Avg. Mol. Weight |
|---|---|---|---|---|---|---|---|
5895 |
55 |
905 |
346.8 |
38.91 |
Amino acid frequency
Ala |
Cys |
Asp |
Glu |
Phe |
Gly |
His |
Ile |
Lys |
Leu |
|---|---|---|---|---|---|---|---|---|---|
7.871 ± 0.402 | 1.425 ± 0.344 |
4.36 ± 0.25 | 6.378 ± 0.725 |
4.224 ± 0.321 | 5.7 ± 0.338 |
2.358 ± 0.226 | 4.139 ± 0.29 |
4.224 ± 0.56 | 9.5 ± 0.566 |
Met |
Asn |
Gln |
Pro |
Arg |
Ser |
Thr |
Val |
Trp |
Tyr |
|---|---|---|---|---|---|---|---|---|---|
2.884 ± 0.163 | 5.327 ± 0.633 |
6.429 ± 0.423 | 4.122 ± 0.328 |
6.497 ± 0.874 | 7.226 ± 0.365 |
5.818 ± 0.308 | 7.023 ± 0.358 |
1.187 ± 0.121 | 3.308 ± 0.493 |
Most of the basic statistics you can see at this page can be downloaded from this CSV file
See this proteome in:

Proteome-pI is available under Creative Commons Attribution-NoDerivs license, for more details see here
| Reference: Kozlowski LP. Proteome-pI 2.0: Proteome Isoelectric Point Database Update. Nucleic Acids Res. 2021, doi: 10.1093/nar/gkab944 | Contact: Lukasz P. Kozlowski |