Microbacterium trichothecenolyticum
Taxonomy: cellular organisms; Bacteria; Terrabacteria group; Actinobacteria; Actinomycetia; Micrococcales; Microbacteriaceae; Microbacterium
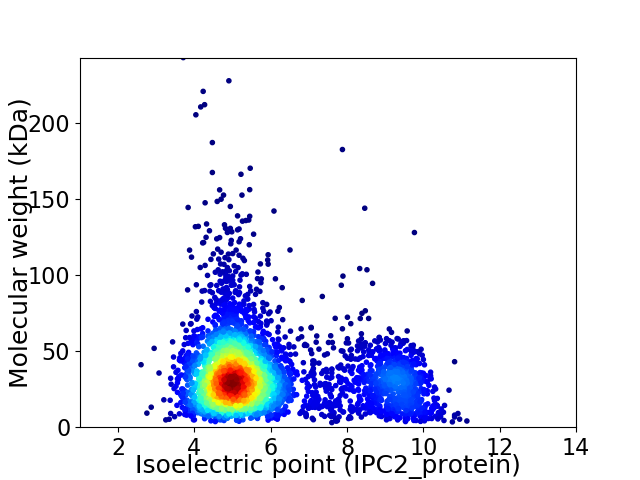
Average proteome isoelectric point is 5.91
Get precalculated fractions of proteins

Virtual 2D-PAGE plot for 4075 proteins (isoelectric point calculated using IPC2_protein)
Get csv file with sequences according to given criteria:
* You can choose from 21 different methods for calculating isoelectric point
Summary statistics related to proteome-wise predictions


Protein with the lowest isoelectric point:
>tr|A0A0M2HAT0|A0A0M2HAT0_9MICO Uncharacterized protein OS=Microbacterium trichothecenolyticum OX=69370 GN=RS82_01258 PE=4 SV=1
MM1 pKa = 7.43KK2 pKa = 10.11KK3 pKa = 10.33LRR5 pKa = 11.84VGAVAAATGVAVVLTGCASGSGGEE29 pKa = 4.29SSTGGKK35 pKa = 7.29PTIVVDD41 pKa = 3.43MWAGSEE47 pKa = 4.08ADD49 pKa = 3.48TTALEE54 pKa = 4.11EE55 pKa = 4.08QVAIAQEE62 pKa = 4.2EE63 pKa = 4.41NPDD66 pKa = 3.53VTIKK70 pKa = 10.96LQTAPWNDD78 pKa = 3.4FFTKK82 pKa = 9.7LTTNMASGNMACVTGMSGAQLGGFTDD108 pKa = 4.69GFRR111 pKa = 11.84EE112 pKa = 4.14LTAQDD117 pKa = 4.67LEE119 pKa = 4.59TAGLDD124 pKa = 3.59FADD127 pKa = 5.05FNPGAEE133 pKa = 4.81GILSFEE139 pKa = 4.36GGLYY143 pKa = 10.21GVPFDD148 pKa = 3.71VATMLVYY155 pKa = 10.71YY156 pKa = 9.69NQDD159 pKa = 2.91MLTATGAATPEE170 pKa = 4.17IGWTFDD176 pKa = 3.5DD177 pKa = 5.21FEE179 pKa = 7.65DD180 pKa = 3.5IATAATADD188 pKa = 3.51GKK190 pKa = 11.19YY191 pKa = 10.2GFGMGMGGYY200 pKa = 8.64QWMSMPIALSGKK212 pKa = 9.61QPASEE217 pKa = 5.14DD218 pKa = 3.69GTLHH222 pKa = 7.24IDD224 pKa = 4.47DD225 pKa = 5.54PDD227 pKa = 4.0FVDD230 pKa = 3.46AASWYY235 pKa = 9.86SGLVTDD241 pKa = 5.45LGVAAPVASASDD253 pKa = 3.72TGWGEE258 pKa = 3.77NQYY261 pKa = 9.94TGGNAAMAVDD271 pKa = 4.52GTWNAVSYY279 pKa = 10.88LNNEE283 pKa = 4.1SGFAAGMAPLPTGEE297 pKa = 5.1HH298 pKa = 6.43GNSGPILGSGYY309 pKa = 10.43GISKK313 pKa = 8.67TCDD316 pKa = 3.23DD317 pKa = 4.65PEE319 pKa = 5.58AALKK323 pKa = 11.1VMGSLLGKK331 pKa = 9.88DD332 pKa = 3.36AQDD335 pKa = 4.4YY336 pKa = 9.37IASSGRR342 pKa = 11.84SYY344 pKa = 10.55PARR347 pKa = 11.84TEE349 pKa = 4.03SQPLYY354 pKa = 10.21FDD356 pKa = 5.4SIDD359 pKa = 3.34EE360 pKa = 4.37EE361 pKa = 4.58YY362 pKa = 10.54RR363 pKa = 11.84DD364 pKa = 3.56QVQTVFEE371 pKa = 4.59SAFATTVPLYY381 pKa = 7.59MTKK384 pKa = 9.75NWEE387 pKa = 4.18KK388 pKa = 10.44LDD390 pKa = 5.16SYY392 pKa = 10.58IQPNLVSVYY401 pKa = 9.4NGQMEE406 pKa = 4.27MSDD409 pKa = 4.03LLEE412 pKa = 4.29SAQAQFGNN420 pKa = 3.99
MM1 pKa = 7.43KK2 pKa = 10.11KK3 pKa = 10.33LRR5 pKa = 11.84VGAVAAATGVAVVLTGCASGSGGEE29 pKa = 4.29SSTGGKK35 pKa = 7.29PTIVVDD41 pKa = 3.43MWAGSEE47 pKa = 4.08ADD49 pKa = 3.48TTALEE54 pKa = 4.11EE55 pKa = 4.08QVAIAQEE62 pKa = 4.2EE63 pKa = 4.41NPDD66 pKa = 3.53VTIKK70 pKa = 10.96LQTAPWNDD78 pKa = 3.4FFTKK82 pKa = 9.7LTTNMASGNMACVTGMSGAQLGGFTDD108 pKa = 4.69GFRR111 pKa = 11.84EE112 pKa = 4.14LTAQDD117 pKa = 4.67LEE119 pKa = 4.59TAGLDD124 pKa = 3.59FADD127 pKa = 5.05FNPGAEE133 pKa = 4.81GILSFEE139 pKa = 4.36GGLYY143 pKa = 10.21GVPFDD148 pKa = 3.71VATMLVYY155 pKa = 10.71YY156 pKa = 9.69NQDD159 pKa = 2.91MLTATGAATPEE170 pKa = 4.17IGWTFDD176 pKa = 3.5DD177 pKa = 5.21FEE179 pKa = 7.65DD180 pKa = 3.5IATAATADD188 pKa = 3.51GKK190 pKa = 11.19YY191 pKa = 10.2GFGMGMGGYY200 pKa = 8.64QWMSMPIALSGKK212 pKa = 9.61QPASEE217 pKa = 5.14DD218 pKa = 3.69GTLHH222 pKa = 7.24IDD224 pKa = 4.47DD225 pKa = 5.54PDD227 pKa = 4.0FVDD230 pKa = 3.46AASWYY235 pKa = 9.86SGLVTDD241 pKa = 5.45LGVAAPVASASDD253 pKa = 3.72TGWGEE258 pKa = 3.77NQYY261 pKa = 9.94TGGNAAMAVDD271 pKa = 4.52GTWNAVSYY279 pKa = 10.88LNNEE283 pKa = 4.1SGFAAGMAPLPTGEE297 pKa = 5.1HH298 pKa = 6.43GNSGPILGSGYY309 pKa = 10.43GISKK313 pKa = 8.67TCDD316 pKa = 3.23DD317 pKa = 4.65PEE319 pKa = 5.58AALKK323 pKa = 11.1VMGSLLGKK331 pKa = 9.88DD332 pKa = 3.36AQDD335 pKa = 4.4YY336 pKa = 9.37IASSGRR342 pKa = 11.84SYY344 pKa = 10.55PARR347 pKa = 11.84TEE349 pKa = 4.03SQPLYY354 pKa = 10.21FDD356 pKa = 5.4SIDD359 pKa = 3.34EE360 pKa = 4.37EE361 pKa = 4.58YY362 pKa = 10.54RR363 pKa = 11.84DD364 pKa = 3.56QVQTVFEE371 pKa = 4.59SAFATTVPLYY381 pKa = 7.59MTKK384 pKa = 9.75NWEE387 pKa = 4.18KK388 pKa = 10.44LDD390 pKa = 5.16SYY392 pKa = 10.58IQPNLVSVYY401 pKa = 9.4NGQMEE406 pKa = 4.27MSDD409 pKa = 4.03LLEE412 pKa = 4.29SAQAQFGNN420 pKa = 3.99
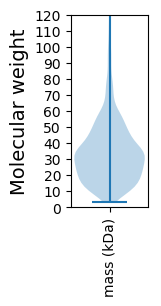
Molecular weight: 44.07 kDa
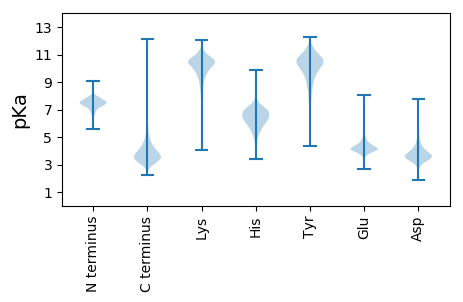
Isoelectric point according different methods:
Protein with the highest isoelectric point:
>tr|A0A0M2HFC5|A0A0M2HFC5_9MICO Uncharacterized protein OS=Microbacterium trichothecenolyticum OX=69370 GN=RS82_00252 PE=4 SV=1
MM1 pKa = 7.4GSVIKK6 pKa = 10.42KK7 pKa = 8.47RR8 pKa = 11.84RR9 pKa = 11.84KK10 pKa = 9.22RR11 pKa = 11.84MAKK14 pKa = 9.41KK15 pKa = 9.87KK16 pKa = 9.7HH17 pKa = 5.84RR18 pKa = 11.84KK19 pKa = 8.56LLRR22 pKa = 11.84KK23 pKa = 7.78TRR25 pKa = 11.84HH26 pKa = 3.65QRR28 pKa = 11.84RR29 pKa = 11.84NKK31 pKa = 9.78KK32 pKa = 9.85
MM1 pKa = 7.4GSVIKK6 pKa = 10.42KK7 pKa = 8.47RR8 pKa = 11.84RR9 pKa = 11.84KK10 pKa = 9.22RR11 pKa = 11.84MAKK14 pKa = 9.41KK15 pKa = 9.87KK16 pKa = 9.7HH17 pKa = 5.84RR18 pKa = 11.84KK19 pKa = 8.56LLRR22 pKa = 11.84KK23 pKa = 7.78TRR25 pKa = 11.84HH26 pKa = 3.65QRR28 pKa = 11.84RR29 pKa = 11.84NKK31 pKa = 9.78KK32 pKa = 9.85
Molecular weight: 4.08 kDa
Isoelectric point according different methods:
Peptides (in silico digests for buttom-up proteomics)
Below you can find in silico digests of the whole proteome with Trypsin, Chymotrypsin, Trypsin+LysC, LysN, ArgC proteases suitable for different mass spec machines.| Try ESI |
 |
|---|
| ChTry ESI |
 |
|---|
| ArgC ESI |
 |
|---|
| LysN ESI |
 |
|---|
| TryLysC ESI |
 |
|---|
| Try MALDI |
 |
|---|
| ChTry MALDI |
 |
|---|
| ArgC MALDI |
 |
|---|
| LysN MALDI |
 |
|---|
| TryLysC MALDI |
 |
|---|
| Try LTQ |
 |
|---|
| ChTry LTQ |
 |
|---|
| ArgC LTQ |
 |
|---|
| LysN LTQ |
 |
|---|
| TryLysC LTQ |
 |
|---|
| Try MSlow |
 |
|---|
| ChTry MSlow |
 |
|---|
| ArgC MSlow |
 |
|---|
| LysN MSlow |
 |
|---|
| TryLysC MSlow |
 |
|---|
| Try MShigh |
 |
|---|
| ChTry MShigh |
 |
|---|
| ArgC MShigh |
 |
|---|
| LysN MShigh |
 |
|---|
| TryLysC MShigh |
 |
|---|
General Statistics
Number of major isoforms |
Number of additional isoforms |
Number of all proteins |
Number of amino acids |
Min. Seq. Length |
Max. Seq. Length |
Avg. Seq. Length |
Avg. Mol. Weight |
|---|---|---|---|---|---|---|---|
0 |
1369450 |
29 |
2346 |
336.1 |
35.89 |
Amino acid frequency
Ala |
Cys |
Asp |
Glu |
Phe |
Gly |
His |
Ile |
Lys |
Leu |
|---|---|---|---|---|---|---|---|---|---|
13.948 ± 0.058 | 0.477 ± 0.008 |
6.437 ± 0.034 | 5.615 ± 0.033 |
3.163 ± 0.022 | 9.05 ± 0.032 |
1.959 ± 0.02 | 4.463 ± 0.031 |
1.821 ± 0.027 | 9.84 ± 0.047 |
Met |
Asn |
Gln |
Pro |
Arg |
Ser |
Thr |
Val |
Trp |
Tyr |
|---|---|---|---|---|---|---|---|---|---|
1.727 ± 0.015 | 1.877 ± 0.022 |
5.555 ± 0.03 | 2.656 ± 0.019 |
7.27 ± 0.049 | 5.433 ± 0.028 |
6.053 ± 0.039 | 9.007 ± 0.034 |
1.617 ± 0.018 | 2.031 ± 0.019 |
Most of the basic statistics you can see at this page can be downloaded from this CSV file
Proteome-pI is available under Creative Commons Attribution-NoDerivs license, for more details see here
| Reference: Kozlowski LP. Proteome-pI 2.0: Proteome Isoelectric Point Database Update. Nucleic Acids Res. 2021, doi: 10.1093/nar/gkab944 | Contact: Lukasz P. Kozlowski |
