Sphingomonas sp. AAP5
Taxonomy: cellular organisms; Bacteria; Proteobacteria; Alphaproteobacteria; Sphingomonadales; Sphingomonadaceae; Sphingomonas; unclassified Sphingomonas
Average proteome isoelectric point is 6.7
Get precalculated fractions of proteins
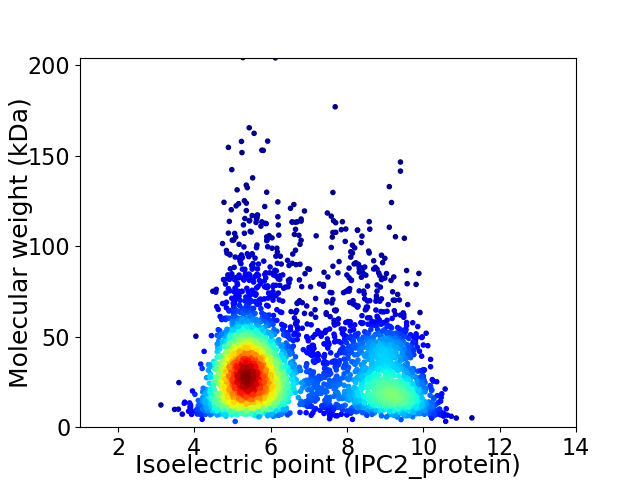
Virtual 2D-PAGE plot for 3972 proteins (isoelectric point calculated using IPC2_protein)
Get csv file with sequences according to given criteria:
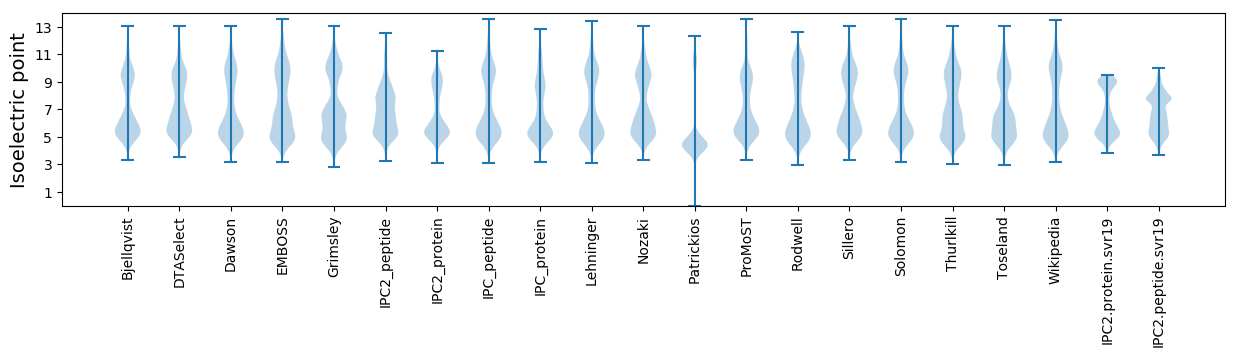
* You can choose from 21 different methods for calculating isoelectric point
Summary statistics related to proteome-wise predictions
Protein with the lowest isoelectric point:
>tr|A0A4P6XAJ4|A0A4P6XAJ4_9SPHN GAF domain-containing protein OS=Sphingomonas sp. AAP5 OX=1523415 GN=E2E30_01610 PE=4 SV=1
MM1 pKa = 7.95WYY3 pKa = 7.87FTWVLGLGLAVGFGILNGMWHH24 pKa = 6.64EE25 pKa = 4.13FHH27 pKa = 7.13LPADD31 pKa = 4.83DD32 pKa = 4.74EE33 pKa = 4.66DD34 pKa = 4.63APPPAA39 pKa = 5.73
MM1 pKa = 7.95WYY3 pKa = 7.87FTWVLGLGLAVGFGILNGMWHH24 pKa = 6.64EE25 pKa = 4.13FHH27 pKa = 7.13LPADD31 pKa = 4.83DD32 pKa = 4.74EE33 pKa = 4.66DD34 pKa = 4.63APPPAA39 pKa = 5.73
Molecular weight: 4.37 kDa
Isoelectric point according different methods:
Protein with the highest isoelectric point:
>tr|A0A4P6X758|A0A4P6X758_9SPHN HNOB domain-containing protein OS=Sphingomonas sp. AAP5 OX=1523415 GN=E2E30_03155 PE=4 SV=1
MM1 pKa = 7.45KK2 pKa = 9.61RR3 pKa = 11.84TFQPSNLVRR12 pKa = 11.84ARR14 pKa = 11.84RR15 pKa = 11.84HH16 pKa = 4.58GFRR19 pKa = 11.84SRR21 pKa = 11.84MATPGGRR28 pKa = 11.84NVIRR32 pKa = 11.84ARR34 pKa = 11.84RR35 pKa = 11.84NRR37 pKa = 11.84GRR39 pKa = 11.84KK40 pKa = 9.0KK41 pKa = 10.58LSAA44 pKa = 4.03
MM1 pKa = 7.45KK2 pKa = 9.61RR3 pKa = 11.84TFQPSNLVRR12 pKa = 11.84ARR14 pKa = 11.84RR15 pKa = 11.84HH16 pKa = 4.58GFRR19 pKa = 11.84SRR21 pKa = 11.84MATPGGRR28 pKa = 11.84NVIRR32 pKa = 11.84ARR34 pKa = 11.84RR35 pKa = 11.84NRR37 pKa = 11.84GRR39 pKa = 11.84KK40 pKa = 9.0KK41 pKa = 10.58LSAA44 pKa = 4.03
Molecular weight: 5.15 kDa
Isoelectric point according different methods:
Peptides (in silico digests for buttom-up proteomics)
Below you can find in silico digests of the whole proteome with Trypsin, Chymotrypsin, Trypsin+LysC, LysN, ArgC proteases suitable for different mass spec machines.| Try ESI |
 |
|---|
| ChTry ESI |
|
|---|
| ArgC ESI |
|
|---|
| LysN ESI |
|
|---|
| TryLysC ESI |
|
|---|
| Try MALDI |
|
|---|
| ChTry MALDI |
|
|---|
| ArgC MALDI |
|
|---|
| LysN MALDI |
|
|---|
| TryLysC MALDI |
|
|---|
| Try LTQ |
|
|---|
| ChTry LTQ |
|
|---|
| ArgC LTQ |
|
|---|
| LysN LTQ |
|
|---|
| TryLysC LTQ |
|
|---|
| Try MSlow |
|
|---|
| ChTry MSlow |
|
|---|
| ArgC MSlow |
|
|---|
| LysN MSlow |
|
|---|
| TryLysC MSlow |
|
|---|
| Try MShigh |
|
|---|
| ChTry MShigh |
|
|---|
| ArgC MShigh |
|
|---|
| LysN MShigh |
|
|---|
| TryLysC MShigh |
|
|---|
General Statistics
Number of major isoforms |
Number of additional isoforms |
Number of all proteins |
Number of amino acids |
Min. Seq. Length |
Max. Seq. Length |
Avg. Seq. Length |
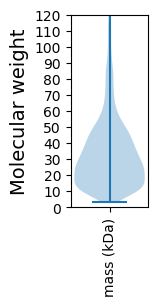
Avg. Mol. Weight |
|---|---|---|---|---|---|---|---|
0 |
1285990 |
29 |
1934 |
323.8 |
34.79 |
Amino acid frequency
Ala |
Cys |
Asp |
Glu |
Phe |
Gly |
His |
Ile |
Lys |
Leu |
|---|---|---|---|---|---|---|---|---|---|
13.952 ± 0.061 | 0.741 ± 0.01 |
5.921 ± 0.026 | 4.855 ± 0.038 |
3.485 ± 0.024 | 8.884 ± 0.034 |
1.989 ± 0.02 | 4.992 ± 0.023 |
2.882 ± 0.029 | 9.921 ± 0.042 |
Met |
Asn |
Gln |
Pro |
Arg |
Ser |
Thr |
Val |
Trp |
Tyr |
|---|---|---|---|---|---|---|---|---|---|
2.266 ± 0.02 | 2.412 ± 0.028 |
5.389 ± 0.024 | 3.019 ± 0.02 |
7.237 ± 0.035 | 5.176 ± 0.029 |
5.777 ± 0.027 | 7.454 ± 0.027 |
1.411 ± 0.016 | 2.237 ± 0.02 |
Most of the basic statistics you can see at this page can be downloaded from this CSV file
See this proteome in:

Proteome-pI is available under Creative Commons Attribution-NoDerivs license, for more details see here
| Reference: Kozlowski LP. Proteome-pI 2.0: Proteome Isoelectric Point Database Update. Nucleic Acids Res. 2021, doi: 10.1093/nar/gkab944 | Contact: Lukasz P. Kozlowski |