Dactylellina haptotyla (strain CBS 200.50) (Nematode-trapping fungus) (Monacrosporium haptotylum)
Taxonomy: cellular organisms; Eukaryota; Opisthokonta; Fungi; Dikarya; Ascomycota; saccharomyceta; Pezizomycotina; Orbiliomycetes; Orbiliales; Orbiliaceae; Dactylellina; Dactylellina haptotyla
Average proteome isoelectric point is 6.42
Get precalculated fractions of proteins

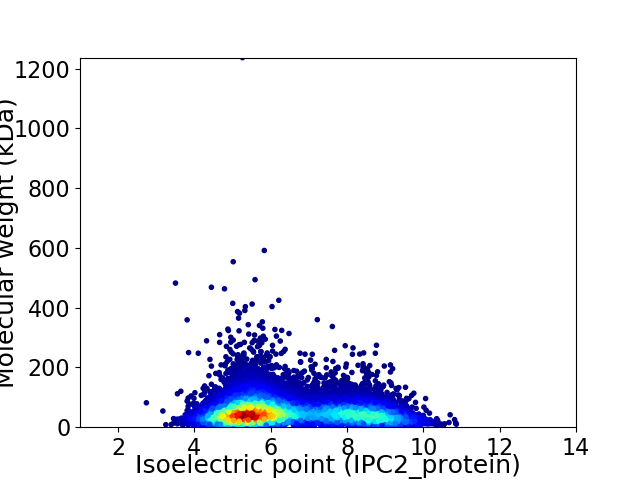
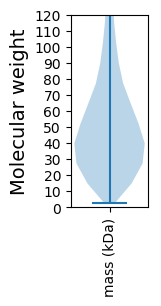
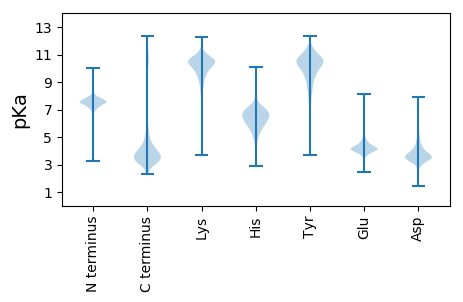
Virtual 2D-PAGE plot for 10959 proteins (isoelectric point calculated using IPC2_protein)
Get csv file with sequences according to given criteria:
* You can choose from 21 different methods for calculating isoelectric point
Summary statistics related to proteome-wise predictions


Protein with the lowest isoelectric point:
>tr|S7ZZP1|S7ZZP1_DACHA Uncharacterized protein OS=Dactylellina haptotyla (strain CBS 200.50) OX=1284197 GN=H072_10625 PE=4 SV=1
MM1 pKa = 7.08YY2 pKa = 10.56VHH4 pKa = 7.02LSVILVAALISTGNSLALPRR24 pKa = 11.84PDD26 pKa = 3.67NVRR29 pKa = 11.84PPCTKK34 pKa = 10.52YY35 pKa = 9.63IYY37 pKa = 10.29QWVFPNWGRR46 pKa = 11.84TEE48 pKa = 4.15TVHH51 pKa = 6.78AATVTSTYY59 pKa = 7.07TTNCGRR65 pKa = 11.84CQDD68 pKa = 3.51IAVTTMEE75 pKa = 4.46IALARR80 pKa = 11.84QWEE83 pKa = 4.25MLRR86 pKa = 11.84YY87 pKa = 8.11TSNLQKK93 pKa = 8.26TTTITLPITKK103 pKa = 10.0AEE105 pKa = 3.85WVYY108 pKa = 10.16TCSPTSSGDD117 pKa = 3.59LGPEE121 pKa = 3.8ATGTAAEE128 pKa = 4.62TPSGDD133 pKa = 3.98SGSGAAPMFFGGGGGATNSSSGGSSGDD160 pKa = 3.28GTGGVGGEE168 pKa = 4.13GGMGVGGAQGGSGMGGEE185 pKa = 4.5GGGNVVSSSTLGGAAGGDD203 pKa = 3.76PGNGGGGSGGGGDD216 pKa = 3.4MGGGGGGGGGGGEE229 pKa = 4.13MEE231 pKa = 5.05AGAVLPNPSVLVLWSDD247 pKa = 3.67TSSITSTPTDD257 pKa = 3.25STTATDD263 pKa = 3.59ASSMSLYY270 pKa = 10.8SGATSTSADD279 pKa = 3.5SEE281 pKa = 4.42ATSVGLDD288 pKa = 3.33STTTTQEE295 pKa = 4.13SPQVTDD301 pKa = 3.35TPITLEE307 pKa = 3.79ATGLVEE313 pKa = 4.79NSNTEE318 pKa = 3.72SGTTGGGDD326 pKa = 3.28SSSSSGGDD334 pKa = 3.14SSSGSGSDD342 pKa = 3.36NGSDD346 pKa = 4.0SGNSDD351 pKa = 3.03GGGDD355 pKa = 3.46GGTT358 pKa = 3.69
MM1 pKa = 7.08YY2 pKa = 10.56VHH4 pKa = 7.02LSVILVAALISTGNSLALPRR24 pKa = 11.84PDD26 pKa = 3.67NVRR29 pKa = 11.84PPCTKK34 pKa = 10.52YY35 pKa = 9.63IYY37 pKa = 10.29QWVFPNWGRR46 pKa = 11.84TEE48 pKa = 4.15TVHH51 pKa = 6.78AATVTSTYY59 pKa = 7.07TTNCGRR65 pKa = 11.84CQDD68 pKa = 3.51IAVTTMEE75 pKa = 4.46IALARR80 pKa = 11.84QWEE83 pKa = 4.25MLRR86 pKa = 11.84YY87 pKa = 8.11TSNLQKK93 pKa = 8.26TTTITLPITKK103 pKa = 10.0AEE105 pKa = 3.85WVYY108 pKa = 10.16TCSPTSSGDD117 pKa = 3.59LGPEE121 pKa = 3.8ATGTAAEE128 pKa = 4.62TPSGDD133 pKa = 3.98SGSGAAPMFFGGGGGATNSSSGGSSGDD160 pKa = 3.28GTGGVGGEE168 pKa = 4.13GGMGVGGAQGGSGMGGEE185 pKa = 4.5GGGNVVSSSTLGGAAGGDD203 pKa = 3.76PGNGGGGSGGGGDD216 pKa = 3.4MGGGGGGGGGGGEE229 pKa = 4.13MEE231 pKa = 5.05AGAVLPNPSVLVLWSDD247 pKa = 3.67TSSITSTPTDD257 pKa = 3.25STTATDD263 pKa = 3.59ASSMSLYY270 pKa = 10.8SGATSTSADD279 pKa = 3.5SEE281 pKa = 4.42ATSVGLDD288 pKa = 3.33STTTTQEE295 pKa = 4.13SPQVTDD301 pKa = 3.35TPITLEE307 pKa = 3.79ATGLVEE313 pKa = 4.79NSNTEE318 pKa = 3.72SGTTGGGDD326 pKa = 3.28SSSSSGGDD334 pKa = 3.14SSSGSGSDD342 pKa = 3.36NGSDD346 pKa = 4.0SGNSDD351 pKa = 3.03GGGDD355 pKa = 3.46GGTT358 pKa = 3.69
Molecular weight: 34.3 kDa
Isoelectric point according different methods:
Protein with the highest isoelectric point:
>tr|S8A749|S8A749_DACHA Uncharacterized protein OS=Dactylellina haptotyla (strain CBS 200.50) OX=1284197 GN=H072_7433 PE=4 SV=1
MM1 pKa = 8.04PYY3 pKa = 10.32RR4 pKa = 11.84RR5 pKa = 11.84THH7 pKa = 5.85RR8 pKa = 11.84RR9 pKa = 11.84TRR11 pKa = 11.84PATVRR16 pKa = 11.84TTRR19 pKa = 11.84TKK21 pKa = 10.24PSLMDD26 pKa = 3.54RR27 pKa = 11.84LTGRR31 pKa = 11.84RR32 pKa = 11.84SHH34 pKa = 5.47TTVTTTRR41 pKa = 11.84ATHH44 pKa = 4.89GHH46 pKa = 5.23GHH48 pKa = 5.86HH49 pKa = 6.72HH50 pKa = 6.27HH51 pKa = 6.79HH52 pKa = 6.52VAPVAPVHH60 pKa = 5.17HH61 pKa = 6.48QKK63 pKa = 10.64RR64 pKa = 11.84KK65 pKa = 7.44PTLSDD70 pKa = 3.28KK71 pKa = 11.22VSGALMKK78 pKa = 10.54IKK80 pKa = 10.51GSLTRR85 pKa = 11.84RR86 pKa = 11.84PGLKK90 pKa = 10.05AAGTRR95 pKa = 11.84RR96 pKa = 11.84QRR98 pKa = 11.84GTDD101 pKa = 2.82GRR103 pKa = 11.84GSHH106 pKa = 5.81RR107 pKa = 11.84RR108 pKa = 11.84RR109 pKa = 11.84WW110 pKa = 3.3
MM1 pKa = 8.04PYY3 pKa = 10.32RR4 pKa = 11.84RR5 pKa = 11.84THH7 pKa = 5.85RR8 pKa = 11.84RR9 pKa = 11.84TRR11 pKa = 11.84PATVRR16 pKa = 11.84TTRR19 pKa = 11.84TKK21 pKa = 10.24PSLMDD26 pKa = 3.54RR27 pKa = 11.84LTGRR31 pKa = 11.84RR32 pKa = 11.84SHH34 pKa = 5.47TTVTTTRR41 pKa = 11.84ATHH44 pKa = 4.89GHH46 pKa = 5.23GHH48 pKa = 5.86HH49 pKa = 6.72HH50 pKa = 6.27HH51 pKa = 6.79HH52 pKa = 6.52VAPVAPVHH60 pKa = 5.17HH61 pKa = 6.48QKK63 pKa = 10.64RR64 pKa = 11.84KK65 pKa = 7.44PTLSDD70 pKa = 3.28KK71 pKa = 11.22VSGALMKK78 pKa = 10.54IKK80 pKa = 10.51GSLTRR85 pKa = 11.84RR86 pKa = 11.84PGLKK90 pKa = 10.05AAGTRR95 pKa = 11.84RR96 pKa = 11.84QRR98 pKa = 11.84GTDD101 pKa = 2.82GRR103 pKa = 11.84GSHH106 pKa = 5.81RR107 pKa = 11.84RR108 pKa = 11.84RR109 pKa = 11.84WW110 pKa = 3.3
Molecular weight: 12.56 kDa
Isoelectric point according different methods:
Peptides (in silico digests for buttom-up proteomics)
Below you can find in silico digests of the whole proteome with Trypsin, Chymotrypsin, Trypsin+LysC, LysN, ArgC proteases suitable for different mass spec machines.| Try ESI |
 |
|---|
| ChTry ESI |
 |
|---|
| ArgC ESI |
 |
|---|
| LysN ESI |
 |
|---|
| TryLysC ESI |
 |
|---|
| Try MALDI |
 |
|---|
| ChTry MALDI |
 |
|---|
| ArgC MALDI |
 |
|---|
| LysN MALDI |
 |
|---|
| TryLysC MALDI |
 |
|---|
| Try LTQ |
 |
|---|
| ChTry LTQ |
 |
|---|
| ArgC LTQ |
 |
|---|
| LysN LTQ |
 |
|---|
| TryLysC LTQ |
 |
|---|
| Try MSlow |
 |
|---|
| ChTry MSlow |
 |
|---|
| ArgC MSlow |
 |
|---|
| LysN MSlow |
 |
|---|
| TryLysC MSlow |
 |
|---|
| Try MShigh |
 |
|---|
| ChTry MShigh |
 |
|---|
| ArgC MShigh |
 |
|---|
| LysN MShigh |
 |
|---|
| TryLysC MShigh |
 |
|---|
General Statistics
Number of major isoforms |
Number of additional isoforms |
Number of all proteins |
Number of amino acids |
Min. Seq. Length |
Max. Seq. Length |
Avg. Seq. Length |
Avg. Mol. Weight |
|---|---|---|---|---|---|---|---|
0 |
5669352 |
22 |
11200 |
517.3 |
57.31 |
Amino acid frequency
Ala |
Cys |
Asp |
Glu |
Phe |
Gly |
His |
Ile |
Lys |
Leu |
|---|---|---|---|---|---|---|---|---|---|
7.858 ± 0.021 | 1.193 ± 0.009 |
5.697 ± 0.016 | 6.36 ± 0.029 |
3.729 ± 0.016 | 6.767 ± 0.024 |
2.137 ± 0.012 | 5.405 ± 0.019 |
5.477 ± 0.023 | 8.446 ± 0.026 |
Met |
Asn |
Gln |
Pro |
Arg |
Ser |
Thr |
Val |
Trp |
Tyr |
|---|---|---|---|---|---|---|---|---|---|
2.091 ± 0.008 | 4.07 ± 0.015 |
6.128 ± 0.027 | 3.808 ± 0.02 |
5.599 ± 0.022 | 8.337 ± 0.029 |
6.63 ± 0.046 | 5.95 ± 0.019 |
1.358 ± 0.008 | 2.96 ± 0.011 |
Most of the basic statistics you can see at this page can be downloaded from this CSV file
Proteome-pI is available under Creative Commons Attribution-NoDerivs license, for more details see here
| Reference: Kozlowski LP. Proteome-pI 2.0: Proteome Isoelectric Point Database Update. Nucleic Acids Res. 2021, doi: 10.1093/nar/gkab944 | Contact: Lukasz P. Kozlowski |
