Cassava common mosaic virus
Taxonomy: Viruses; Riboviria; Orthornavirae; Kitrinoviricota; Alsuviricetes; Tymovirales; Alphaflexiviridae; Potexvirus
Average proteome isoelectric point is 6.82
Get precalculated fractions of proteins

Virtual 2D-PAGE plot for 5 proteins (isoelectric point calculated using IPC2_protein)
Get csv file with sequences according to given criteria:
* You can choose from 21 different methods for calculating isoelectric point
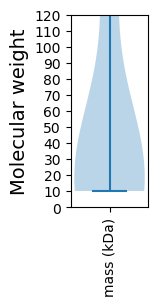
Summary statistics related to proteome-wise predictions


Protein with the lowest isoelectric point:
>tr|Q65978|Q65978_9VIRU Coat protein OS=Cassava common mosaic virus OX=39046 PE=3 SV=1
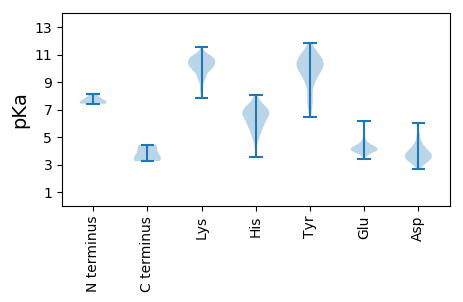
MM1 pKa = 7.45ATPTSTTPTTATITQAATTPLSALSTAPTDD31 pKa = 3.78EE32 pKa = 4.19EE33 pKa = 5.28LSRR36 pKa = 11.84LDD38 pKa = 5.07LKK40 pKa = 10.71PASNLVASADD50 pKa = 3.66ALSAIAADD58 pKa = 3.66WASLKK63 pKa = 10.84VPTAQLMRR71 pKa = 11.84HH72 pKa = 5.84ALDD75 pKa = 3.84LVNFCFDD82 pKa = 3.9SGSSKK87 pKa = 9.28YY88 pKa = 6.42TTVEE92 pKa = 4.14GSSPTPTIPRR102 pKa = 11.84AALAGAVRR110 pKa = 11.84KK111 pKa = 8.27HH112 pKa = 3.55TTLRR116 pKa = 11.84QFCRR120 pKa = 11.84YY121 pKa = 7.3YY122 pKa = 11.42AKK124 pKa = 10.32IIWNARR130 pKa = 11.84VKK132 pKa = 11.15ANIPPAGYY140 pKa = 10.7ANAHH144 pKa = 6.47IKK146 pKa = 10.25PEE148 pKa = 3.86QAFAGFDD155 pKa = 3.58FFDD158 pKa = 3.71GVMNVAALEE167 pKa = 4.09PSGGLVRR174 pKa = 11.84EE175 pKa = 4.33PTPQEE180 pKa = 3.71IIAAEE185 pKa = 4.14TARR188 pKa = 11.84SLNLFEE194 pKa = 5.15AQSKK198 pKa = 10.12GNNLATNATQVTRR211 pKa = 11.84GRR213 pKa = 11.84LSSSEE218 pKa = 3.99PQVQFLTGVDD228 pKa = 3.65EE229 pKa = 4.44
MM1 pKa = 7.45ATPTSTTPTTATITQAATTPLSALSTAPTDD31 pKa = 3.78EE32 pKa = 4.19EE33 pKa = 5.28LSRR36 pKa = 11.84LDD38 pKa = 5.07LKK40 pKa = 10.71PASNLVASADD50 pKa = 3.66ALSAIAADD58 pKa = 3.66WASLKK63 pKa = 10.84VPTAQLMRR71 pKa = 11.84HH72 pKa = 5.84ALDD75 pKa = 3.84LVNFCFDD82 pKa = 3.9SGSSKK87 pKa = 9.28YY88 pKa = 6.42TTVEE92 pKa = 4.14GSSPTPTIPRR102 pKa = 11.84AALAGAVRR110 pKa = 11.84KK111 pKa = 8.27HH112 pKa = 3.55TTLRR116 pKa = 11.84QFCRR120 pKa = 11.84YY121 pKa = 7.3YY122 pKa = 11.42AKK124 pKa = 10.32IIWNARR130 pKa = 11.84VKK132 pKa = 11.15ANIPPAGYY140 pKa = 10.7ANAHH144 pKa = 6.47IKK146 pKa = 10.25PEE148 pKa = 3.86QAFAGFDD155 pKa = 3.58FFDD158 pKa = 3.71GVMNVAALEE167 pKa = 4.09PSGGLVRR174 pKa = 11.84EE175 pKa = 4.33PTPQEE180 pKa = 3.71IIAAEE185 pKa = 4.14TARR188 pKa = 11.84SLNLFEE194 pKa = 5.15AQSKK198 pKa = 10.12GNNLATNATQVTRR211 pKa = 11.84GRR213 pKa = 11.84LSSSEE218 pKa = 3.99PQVQFLTGVDD228 pKa = 3.65EE229 pKa = 4.44
Molecular weight: 24.27 kDa
Isoelectric point according different methods:
Protein with the highest isoelectric point:
>tr|Q65977|Q65977_9VIRU Movement protein TGBp3 OS=Cassava common mosaic virus OX=39046 PE=3 SV=1
MM1 pKa = 7.56SGHH4 pKa = 6.34HH5 pKa = 6.78HH6 pKa = 6.73LTPPTDD12 pKa = 3.36YY13 pKa = 11.28SKK15 pKa = 11.51AVLAAVIGISSSIFIHH31 pKa = 6.66TITRR35 pKa = 11.84STNPHH40 pKa = 5.62VGDD43 pKa = 4.66NIHH46 pKa = 6.73ALPHH50 pKa = 5.36GGYY53 pKa = 10.22YY54 pKa = 9.63RR55 pKa = 11.84DD56 pKa = 3.77GTKK59 pKa = 8.99TVYY62 pKa = 10.69YY63 pKa = 10.02GGPGPTAVSASAGKK77 pKa = 9.73FWAFLCIFTISGFLFFSNRR96 pKa = 11.84HH97 pKa = 4.85RR98 pKa = 11.84TNSSCSCRR106 pKa = 11.84PNLGANN112 pKa = 3.5
MM1 pKa = 7.56SGHH4 pKa = 6.34HH5 pKa = 6.78HH6 pKa = 6.73LTPPTDD12 pKa = 3.36YY13 pKa = 11.28SKK15 pKa = 11.51AVLAAVIGISSSIFIHH31 pKa = 6.66TITRR35 pKa = 11.84STNPHH40 pKa = 5.62VGDD43 pKa = 4.66NIHH46 pKa = 6.73ALPHH50 pKa = 5.36GGYY53 pKa = 10.22YY54 pKa = 9.63RR55 pKa = 11.84DD56 pKa = 3.77GTKK59 pKa = 8.99TVYY62 pKa = 10.69YY63 pKa = 10.02GGPGPTAVSASAGKK77 pKa = 9.73FWAFLCIFTISGFLFFSNRR96 pKa = 11.84HH97 pKa = 4.85RR98 pKa = 11.84TNSSCSCRR106 pKa = 11.84PNLGANN112 pKa = 3.5
Molecular weight: 12.01 kDa
Isoelectric point according different methods:
Peptides (in silico digests for buttom-up proteomics)
Below you can find in silico digests of the whole proteome with Trypsin, Chymotrypsin, Trypsin+LysC, LysN, ArgC proteases suitable for different mass spec machines.| Try ESI |
 |
|---|
| ChTry ESI |
 |
|---|
| ArgC ESI |
 |
|---|
| LysN ESI |
 |
|---|
| TryLysC ESI |
 |
|---|
| Try MALDI |
 |
|---|
| ChTry MALDI |
 |
|---|
| ArgC MALDI |
 |
|---|
| LysN MALDI |
 |
|---|
| TryLysC MALDI |
 |
|---|
| Try LTQ |
 |
|---|
| ChTry LTQ |
 |
|---|
| ArgC LTQ |
 |
|---|
| LysN LTQ |
 |
|---|
| TryLysC LTQ |
 |
|---|
| Try MSlow |
 |
|---|
| ChTry MSlow |
 |
|---|
| ArgC MSlow |
 |
|---|
| LysN MSlow |
 |
|---|
| TryLysC MSlow |
 |
|---|
| Try MShigh |
 |
|---|
| ChTry MShigh |
 |
|---|
| ArgC MShigh |
 |
|---|
| LysN MShigh |
 |
|---|
| TryLysC MShigh |
 |
|---|
General Statistics
Number of major isoforms |
Number of additional isoforms |
Number of all proteins |
Number of amino acids |
Min. Seq. Length |
Max. Seq. Length |
Avg. Seq. Length |
Avg. Mol. Weight |
|---|---|---|---|---|---|---|---|
0 |
2118 |
97 |
1449 |
423.6 |
47.31 |
Amino acid frequency
Ala |
Cys |
Asp |
Glu |
Phe |
Gly |
His |
Ile |
Lys |
Leu |
|---|---|---|---|---|---|---|---|---|---|
8.546 ± 1.472 | 1.228 ± 0.396 |
4.344 ± 0.456 | 6.468 ± 1.556 |
3.919 ± 0.259 | 5.241 ± 1.202 |
3.069 ± 0.688 | 5.996 ± 0.483 |
6.657 ± 1.572 | 10.67 ± 0.9 |
Met |
Asn |
Gln |
Pro |
Arg |
Ser |
Thr |
Val |
Trp |
Tyr |
|---|---|---|---|---|---|---|---|---|---|
1.889 ± 0.562 | 3.683 ± 0.328 |
6.374 ± 0.574 | 4.438 ± 0.655 |
4.297 ± 0.298 | 7.224 ± 1.552 |
7.129 ± 1.03 | 4.485 ± 0.731 |
1.228 ± 0.272 | 3.116 ± 0.354 |
Most of the basic statistics you can see at this page can be downloaded from this CSV file
Proteome-pI is available under Creative Commons Attribution-NoDerivs license, for more details see here
| Reference: Kozlowski LP. Proteome-pI 2.0: Proteome Isoelectric Point Database Update. Nucleic Acids Res. 2021, doi: 10.1093/nar/gkab944 | Contact: Lukasz P. Kozlowski |
