Peptoniphilus sp. BV3C26
Taxonomy: cellular organisms; Bacteria; Terrabacteria group; Firmicutes; Tissierellia; Tissierellales; Peptoniphilaceae; Peptoniphilus; unclassified Peptoniphilus
Average proteome isoelectric point is 6.76
Get precalculated fractions of proteins
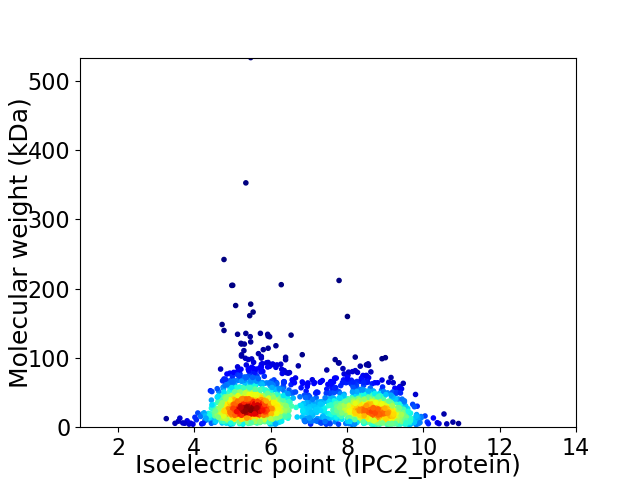
Virtual 2D-PAGE plot for 1924 proteins (isoelectric point calculated using IPC2_protein)
Get csv file with sequences according to given criteria:
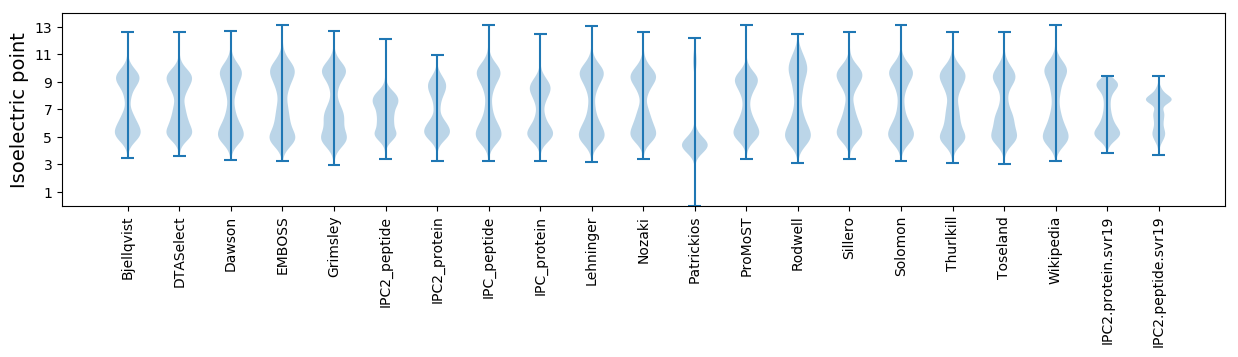
* You can choose from 21 different methods for calculating isoelectric point
Summary statistics related to proteome-wise predictions
Protein with the lowest isoelectric point:
>tr|U7UC12|U7UC12_9FIRM Sigma-70 region 2 OS=Peptoniphilus sp. BV3C26 OX=1111134 GN=HMPREF1253_1044 PE=3 SV=1
MM1 pKa = 7.1YY2 pKa = 8.96PSLFVVEE9 pKa = 4.22VEE11 pKa = 4.49NGIEE15 pKa = 4.17MTTSSYY21 pKa = 10.76TYY23 pKa = 10.98SDD25 pKa = 3.73VLTSTVMISVIEE37 pKa = 4.11DD38 pKa = 4.41DD39 pKa = 4.62IDD41 pKa = 4.04LEE43 pKa = 4.3EE44 pKa = 4.1YY45 pKa = 10.37RR46 pKa = 11.84EE47 pKa = 4.35KK48 pKa = 10.71ISS50 pKa = 3.61
MM1 pKa = 7.1YY2 pKa = 8.96PSLFVVEE9 pKa = 4.22VEE11 pKa = 4.49NGIEE15 pKa = 4.17MTTSSYY21 pKa = 10.76TYY23 pKa = 10.98SDD25 pKa = 3.73VLTSTVMISVIEE37 pKa = 4.11DD38 pKa = 4.41DD39 pKa = 4.62IDD41 pKa = 4.04LEE43 pKa = 4.3EE44 pKa = 4.1YY45 pKa = 10.37RR46 pKa = 11.84EE47 pKa = 4.35KK48 pKa = 10.71ISS50 pKa = 3.61
Molecular weight: 5.74 kDa
Isoelectric point according different methods:
Protein with the highest isoelectric point:
>tr|U7UPY1|U7UPY1_9FIRM ABC transporter ATP-binding protein OS=Peptoniphilus sp. BV3C26 OX=1111134 GN=HMPREF1253_0273 PE=4 SV=1
MM1 pKa = 7.45KK2 pKa = 9.61RR3 pKa = 11.84TFQPKK8 pKa = 8.18NKK10 pKa = 8.76QRR12 pKa = 11.84KK13 pKa = 7.85RR14 pKa = 11.84EE15 pKa = 3.9HH16 pKa = 6.14GFRR19 pKa = 11.84ARR21 pKa = 11.84MRR23 pKa = 11.84TKK25 pKa = 10.32SGRR28 pKa = 11.84AVIKK32 pKa = 9.97ARR34 pKa = 11.84RR35 pKa = 11.84RR36 pKa = 11.84KK37 pKa = 9.35GRR39 pKa = 11.84KK40 pKa = 8.86KK41 pKa = 10.58LSAA44 pKa = 3.95
MM1 pKa = 7.45KK2 pKa = 9.61RR3 pKa = 11.84TFQPKK8 pKa = 8.18NKK10 pKa = 8.76QRR12 pKa = 11.84KK13 pKa = 7.85RR14 pKa = 11.84EE15 pKa = 3.9HH16 pKa = 6.14GFRR19 pKa = 11.84ARR21 pKa = 11.84MRR23 pKa = 11.84TKK25 pKa = 10.32SGRR28 pKa = 11.84AVIKK32 pKa = 9.97ARR34 pKa = 11.84RR35 pKa = 11.84RR36 pKa = 11.84KK37 pKa = 9.35GRR39 pKa = 11.84KK40 pKa = 8.86KK41 pKa = 10.58LSAA44 pKa = 3.95
Molecular weight: 5.34 kDa
Isoelectric point according different methods:
Peptides (in silico digests for buttom-up proteomics)
Below you can find in silico digests of the whole proteome with Trypsin, Chymotrypsin, Trypsin+LysC, LysN, ArgC proteases suitable for different mass spec machines.| Try ESI |
 |
|---|
| ChTry ESI |
|
|---|
| ArgC ESI |
|
|---|
| LysN ESI |
|
|---|
| TryLysC ESI |
|
|---|
| Try MALDI |
|
|---|
| ChTry MALDI |
|
|---|
| ArgC MALDI |
|
|---|
| LysN MALDI |
|
|---|
| TryLysC MALDI |
|
|---|
| Try LTQ |
|
|---|
| ChTry LTQ |
|
|---|
| ArgC LTQ |
|
|---|
| LysN LTQ |
|
|---|
| TryLysC LTQ |
|
|---|
| Try MSlow |
|
|---|
| ChTry MSlow |
|
|---|
| ArgC MSlow |
|
|---|
| LysN MSlow |
|
|---|
| TryLysC MSlow |
|
|---|
| Try MShigh |
|
|---|
| ChTry MShigh |
|
|---|
| ArgC MShigh |
|
|---|
| LysN MShigh |
|
|---|
| TryLysC MShigh |
|
|---|
General Statistics
Number of major isoforms |
Number of additional isoforms |
Number of all proteins |
Number of amino acids |
Min. Seq. Length |
Max. Seq. Length |
Avg. Seq. Length |
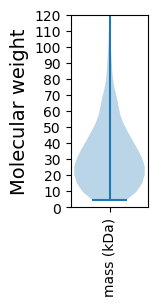
Avg. Mol. Weight |
|---|---|---|---|---|---|---|---|
0 |
581713 |
37 |
4792 |
302.3 |
34.31 |
Amino acid frequency
Ala |
Cys |
Asp |
Glu |
Phe |
Gly |
His |
Ile |
Lys |
Leu |
|---|---|---|---|---|---|---|---|---|---|
5.568 ± 0.063 | 0.86 ± 0.018 |
5.916 ± 0.055 | 7.875 ± 0.069 |
4.789 ± 0.051 | 6.387 ± 0.057 |
1.276 ± 0.022 | 9.368 ± 0.069 |
9.954 ± 0.076 | 9.453 ± 0.066 |
Met |
Asn |
Gln |
Pro |
Arg |
Ser |
Thr |
Val |
Trp |
Tyr |
|---|---|---|---|---|---|---|---|---|---|
2.516 ± 0.032 | 5.935 ± 0.056 |
2.838 ± 0.032 | 2.444 ± 0.028 |
3.655 ± 0.044 | 6.128 ± 0.043 |
4.62 ± 0.054 | 5.792 ± 0.049 |
0.622 ± 0.016 | 4.006 ± 0.041 |
Most of the basic statistics you can see at this page can be downloaded from this CSV file
See this proteome in:

Proteome-pI is available under Creative Commons Attribution-NoDerivs license, for more details see here
| Reference: Kozlowski LP. Proteome-pI 2.0: Proteome Isoelectric Point Database Update. Nucleic Acids Res. 2021, doi: 10.1093/nar/gkab944 | Contact: Lukasz P. Kozlowski |