Mapuera orthorubulavirus
Taxonomy: Viruses; Riboviria; Orthornavirae; Negarnaviricota; Haploviricotina; Monjiviricetes; Mononegavirales; Paramyxoviridae; Rubulavirinae; Orthorubulavirus
Average proteome isoelectric point is 6.46
Get precalculated fractions of proteins

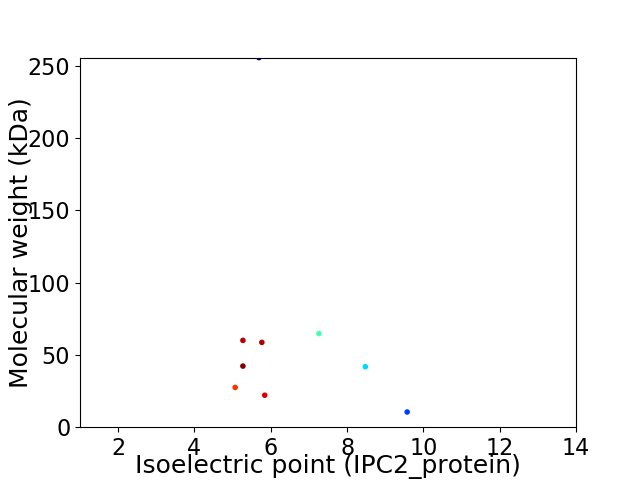
Virtual 2D-PAGE plot for 9 proteins (isoelectric point calculated using IPC2_protein)
Get csv file with sequences according to given criteria:
* You can choose from 21 different methods for calculating isoelectric point
Summary statistics related to proteome-wise predictions


Protein with the lowest isoelectric point:
>tr|A3R042|A3R042_9MONO Isoform of A3R040 W protein OS=Mapuera orthorubulavirus OX=2560582 GN=P/V PE=4 SV=1
MM1 pKa = 8.2DD2 pKa = 4.36LTFSPSEE9 pKa = 3.74IDD11 pKa = 4.2DD12 pKa = 4.09LFGTGLDD19 pKa = 3.74TIQFITDD26 pKa = 3.32QKK28 pKa = 11.21SKK30 pKa = 11.15QNDD33 pKa = 3.12AHH35 pKa = 6.85GSAKK39 pKa = 10.42DD40 pKa = 4.46SPPQTQNGPDD50 pKa = 3.99SGPSDD55 pKa = 3.5PTQVQGAKK63 pKa = 9.38PKK65 pKa = 10.41SHH67 pKa = 7.21GIYY70 pKa = 10.01PPIPTAPPVPTARR83 pKa = 11.84HH84 pKa = 5.39PGSRR88 pKa = 11.84VDD90 pKa = 5.59DD91 pKa = 4.12PVLYY95 pKa = 10.25DD96 pKa = 3.05YY97 pKa = 10.65PRR99 pKa = 11.84RR100 pKa = 11.84GKK102 pKa = 8.82VTTHH106 pKa = 5.88EE107 pKa = 4.46PKK109 pKa = 10.46EE110 pKa = 4.07SSQADD115 pKa = 3.93GYY117 pKa = 11.51EE118 pKa = 3.94YY119 pKa = 10.85DD120 pKa = 4.98SYY122 pKa = 11.54LAQNAKK128 pKa = 9.76TNILKK133 pKa = 10.35RR134 pKa = 11.84WTDD137 pKa = 3.08VSGDD141 pKa = 3.69VEE143 pKa = 5.12PIPMNPEE150 pKa = 3.67VFKK153 pKa = 11.13RR154 pKa = 11.84GADD157 pKa = 3.42LTKK160 pKa = 9.41PTNPNPGHH168 pKa = 5.86RR169 pKa = 11.84RR170 pKa = 11.84EE171 pKa = 4.06WSIGWVGSTVKK182 pKa = 10.54VLEE185 pKa = 4.37WCNPTCSPITATSRR199 pKa = 11.84YY200 pKa = 8.01YY201 pKa = 10.71EE202 pKa = 4.69CVCGICPKK210 pKa = 10.03ICPRR214 pKa = 11.84CVGDD218 pKa = 3.58YY219 pKa = 11.08GHH221 pKa = 6.85VEE223 pKa = 3.69TAGRR227 pKa = 11.84KK228 pKa = 8.34DD229 pKa = 3.02WLSRR233 pKa = 11.84GEE235 pKa = 4.57DD236 pKa = 3.73GSDD239 pKa = 2.95SSSRR243 pKa = 11.84GDD245 pKa = 3.6CEE247 pKa = 4.4SDD249 pKa = 3.29QEE251 pKa = 4.24
MM1 pKa = 8.2DD2 pKa = 4.36LTFSPSEE9 pKa = 3.74IDD11 pKa = 4.2DD12 pKa = 4.09LFGTGLDD19 pKa = 3.74TIQFITDD26 pKa = 3.32QKK28 pKa = 11.21SKK30 pKa = 11.15QNDD33 pKa = 3.12AHH35 pKa = 6.85GSAKK39 pKa = 10.42DD40 pKa = 4.46SPPQTQNGPDD50 pKa = 3.99SGPSDD55 pKa = 3.5PTQVQGAKK63 pKa = 9.38PKK65 pKa = 10.41SHH67 pKa = 7.21GIYY70 pKa = 10.01PPIPTAPPVPTARR83 pKa = 11.84HH84 pKa = 5.39PGSRR88 pKa = 11.84VDD90 pKa = 5.59DD91 pKa = 4.12PVLYY95 pKa = 10.25DD96 pKa = 3.05YY97 pKa = 10.65PRR99 pKa = 11.84RR100 pKa = 11.84GKK102 pKa = 8.82VTTHH106 pKa = 5.88EE107 pKa = 4.46PKK109 pKa = 10.46EE110 pKa = 4.07SSQADD115 pKa = 3.93GYY117 pKa = 11.51EE118 pKa = 3.94YY119 pKa = 10.85DD120 pKa = 4.98SYY122 pKa = 11.54LAQNAKK128 pKa = 9.76TNILKK133 pKa = 10.35RR134 pKa = 11.84WTDD137 pKa = 3.08VSGDD141 pKa = 3.69VEE143 pKa = 5.12PIPMNPEE150 pKa = 3.67VFKK153 pKa = 11.13RR154 pKa = 11.84GADD157 pKa = 3.42LTKK160 pKa = 9.41PTNPNPGHH168 pKa = 5.86RR169 pKa = 11.84RR170 pKa = 11.84EE171 pKa = 4.06WSIGWVGSTVKK182 pKa = 10.54VLEE185 pKa = 4.37WCNPTCSPITATSRR199 pKa = 11.84YY200 pKa = 8.01YY201 pKa = 10.71EE202 pKa = 4.69CVCGICPKK210 pKa = 10.03ICPRR214 pKa = 11.84CVGDD218 pKa = 3.58YY219 pKa = 11.08GHH221 pKa = 6.85VEE223 pKa = 3.69TAGRR227 pKa = 11.84KK228 pKa = 8.34DD229 pKa = 3.02WLSRR233 pKa = 11.84GEE235 pKa = 4.57DD236 pKa = 3.73GSDD239 pKa = 2.95SSSRR243 pKa = 11.84GDD245 pKa = 3.6CEE247 pKa = 4.4SDD249 pKa = 3.29QEE251 pKa = 4.24
Molecular weight: 27.5 kDa
Isoelectric point according different methods:
Protein with the highest isoelectric point:
>tr|A3R043|A3R043_9MONO Isoform of A3R040 C protein OS=Mapuera orthorubulavirus OX=2560582 GN=P/V PE=4 SV=1
MM1 pKa = 7.42TYY3 pKa = 10.34SVQGWTPSSSLQIKK17 pKa = 8.45SQSRR21 pKa = 11.84MMLMALQRR29 pKa = 11.84TAPRR33 pKa = 11.84KK34 pKa = 9.98LRR36 pKa = 11.84MDD38 pKa = 4.12PTPAQAIQHH47 pKa = 5.66RR48 pKa = 11.84CKK50 pKa = 10.7VQNQRR55 pKa = 11.84ATEE58 pKa = 4.13FTHH61 pKa = 7.49LFLLHH66 pKa = 6.82LLCPLQGTLARR77 pKa = 11.84EE78 pKa = 3.93LTIQFSMTTLDD89 pKa = 3.11VGKK92 pKa = 10.56
MM1 pKa = 7.42TYY3 pKa = 10.34SVQGWTPSSSLQIKK17 pKa = 8.45SQSRR21 pKa = 11.84MMLMALQRR29 pKa = 11.84TAPRR33 pKa = 11.84KK34 pKa = 9.98LRR36 pKa = 11.84MDD38 pKa = 4.12PTPAQAIQHH47 pKa = 5.66RR48 pKa = 11.84CKK50 pKa = 10.7VQNQRR55 pKa = 11.84ATEE58 pKa = 4.13FTHH61 pKa = 7.49LFLLHH66 pKa = 6.82LLCPLQGTLARR77 pKa = 11.84EE78 pKa = 3.93LTIQFSMTTLDD89 pKa = 3.11VGKK92 pKa = 10.56
Molecular weight: 10.52 kDa
Isoelectric point according different methods:
Peptides (in silico digests for buttom-up proteomics)
Below you can find in silico digests of the whole proteome with Trypsin, Chymotrypsin, Trypsin+LysC, LysN, ArgC proteases suitable for different mass spec machines.| Try ESI |
 |
|---|
| ChTry ESI |
 |
|---|
| ArgC ESI |
 |
|---|
| LysN ESI |
 |
|---|
| TryLysC ESI |
 |
|---|
| Try MALDI |
 |
|---|
| ChTry MALDI |
 |
|---|
| ArgC MALDI |
 |
|---|
| LysN MALDI |
 |
|---|
| TryLysC MALDI |
 |
|---|
| Try LTQ |
 |
|---|
| ChTry LTQ |
 |
|---|
| ArgC LTQ |
 |
|---|
| LysN LTQ |
 |
|---|
| TryLysC LTQ |
 |
|---|
| Try MSlow |
 |
|---|
| ChTry MSlow |
 |
|---|
| ArgC MSlow |
 |
|---|
| LysN MSlow |
 |
|---|
| TryLysC MSlow |
 |
|---|
| Try MShigh |
 |
|---|
| ChTry MShigh |
 |
|---|
| ArgC MShigh |
 |
|---|
| LysN MShigh |
 |
|---|
| TryLysC MShigh |
 |
|---|
General Statistics
Number of major isoforms |
Number of additional isoforms |
Number of all proteins |
Number of amino acids |
Min. Seq. Length |
Max. Seq. Length |
Avg. Seq. Length |
Avg. Mol. Weight |
|---|---|---|---|---|---|---|---|
5215 |
92 |
2253 |
579.4 |
64.8 |
Amino acid frequency
Ala |
Cys |
Asp |
Glu |
Phe |
Gly |
His |
Ile |
Lys |
Leu |
|---|---|---|---|---|---|---|---|---|---|
6.52 ± 0.806 | 1.86 ± 0.266 |
5.388 ± 0.564 | 4.909 ± 0.425 |
3.394 ± 0.438 | 5.005 ± 0.63 |
2.109 ± 0.319 | 7.344 ± 0.59 |
4.506 ± 0.457 | 10.048 ± 1.263 |
Met |
Asn |
Gln |
Pro |
Arg |
Ser |
Thr |
Val |
Trp |
Tyr |
|---|---|---|---|---|---|---|---|---|---|
2.435 ± 0.42 | 3.912 ± 0.432 |
5.925 ± 0.936 | 5.139 ± 0.637 |
5.043 ± 0.302 | 9.128 ± 0.477 |
6.635 ± 0.452 | 5.887 ± 0.508 |
1.285 ± 0.237 | 3.528 ± 0.325 |
Most of the basic statistics you can see at this page can be downloaded from this CSV file
Proteome-pI is available under Creative Commons Attribution-NoDerivs license, for more details see here
| Reference: Kozlowski LP. Proteome-pI 2.0: Proteome Isoelectric Point Database Update. Nucleic Acids Res. 2021, doi: 10.1093/nar/gkab944 | Contact: Lukasz P. Kozlowski |
