Pseudomonas sp. PGPPP3
Taxonomy: cellular organisms; Bacteria; Proteobacteria; Gammaproteobacteria; Pseudomonadales; Pseudomonadaceae; Pseudomonas; unclassified Pseudomonas
Average proteome isoelectric point is 6.39
Get precalculated fractions of proteins

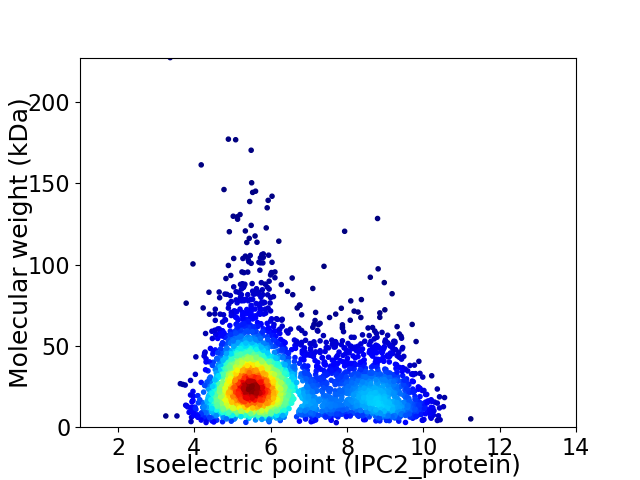
Virtual 2D-PAGE plot for 3785 proteins (isoelectric point calculated using IPC2_protein)
Get csv file with sequences according to given criteria:
* You can choose from 21 different methods for calculating isoelectric point
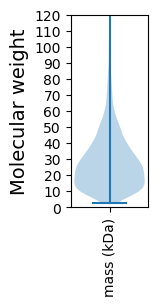
Summary statistics related to proteome-wise predictions


Protein with the lowest isoelectric point:
>tr|A0A257D7C3|A0A257D7C3_9PSED TIGR02449 family protein OS=Pseudomonas sp. PGPPP3 OX=2015555 GN=CFE49_01630 PE=4 SV=1
MM1 pKa = 7.28NRR3 pKa = 11.84LTALTLASLALAPLSARR20 pKa = 11.84AIDD23 pKa = 4.87LNDD26 pKa = 3.34QFSLVITPTLISDD39 pKa = 3.52YY40 pKa = 9.38RR41 pKa = 11.84ASGISQTLGDD51 pKa = 4.33PAAQLNVMLSHH62 pKa = 7.59ASGLYY67 pKa = 10.09AGVWTSNVDD76 pKa = 4.31FGPEE80 pKa = 3.33DD81 pKa = 3.77DD82 pKa = 5.0ARR84 pKa = 11.84QEE86 pKa = 4.03LEE88 pKa = 4.23YY89 pKa = 10.57FAGYY93 pKa = 8.89YY94 pKa = 8.08WQISDD99 pKa = 5.77AISLDD104 pKa = 3.13AWYY107 pKa = 8.62TRR109 pKa = 11.84YY110 pKa = 10.56DD111 pKa = 3.4FSGASQYY118 pKa = 10.19NQNDD122 pKa = 3.39VQFTLDD128 pKa = 3.21AYY130 pKa = 10.61GVLLGAKK137 pKa = 9.49YY138 pKa = 8.67ATNVKK143 pKa = 10.29GPDD146 pKa = 3.53YY147 pKa = 10.89EE148 pKa = 5.19DD149 pKa = 5.33EE150 pKa = 4.47NGDD153 pKa = 3.78WQTGAQDD160 pKa = 3.7EE161 pKa = 4.61DD162 pKa = 3.97LASAFIGYY170 pKa = 7.65RR171 pKa = 11.84TLLPAEE177 pKa = 4.32IGFEE181 pKa = 3.77ARR183 pKa = 11.84YY184 pKa = 9.93EE185 pKa = 4.07YY186 pKa = 11.21VDD188 pKa = 3.69YY189 pKa = 10.99KK190 pKa = 11.53DD191 pKa = 3.72EE192 pKa = 4.29VFWNSDD198 pKa = 3.6FTSSRR203 pKa = 11.84SDD205 pKa = 3.38YY206 pKa = 10.96RR207 pKa = 11.84DD208 pKa = 2.99WEE210 pKa = 4.46VKK212 pKa = 8.59LTRR215 pKa = 11.84DD216 pKa = 3.52LLGVTWGLSYY226 pKa = 10.74IDD228 pKa = 3.81TDD230 pKa = 4.01LSKK233 pKa = 10.97SEE235 pKa = 4.57CVNFMGYY242 pKa = 10.77DD243 pKa = 3.85DD244 pKa = 4.52VCSATLVASASKK256 pKa = 9.63TFF258 pKa = 3.45
MM1 pKa = 7.28NRR3 pKa = 11.84LTALTLASLALAPLSARR20 pKa = 11.84AIDD23 pKa = 4.87LNDD26 pKa = 3.34QFSLVITPTLISDD39 pKa = 3.52YY40 pKa = 9.38RR41 pKa = 11.84ASGISQTLGDD51 pKa = 4.33PAAQLNVMLSHH62 pKa = 7.59ASGLYY67 pKa = 10.09AGVWTSNVDD76 pKa = 4.31FGPEE80 pKa = 3.33DD81 pKa = 3.77DD82 pKa = 5.0ARR84 pKa = 11.84QEE86 pKa = 4.03LEE88 pKa = 4.23YY89 pKa = 10.57FAGYY93 pKa = 8.89YY94 pKa = 8.08WQISDD99 pKa = 5.77AISLDD104 pKa = 3.13AWYY107 pKa = 8.62TRR109 pKa = 11.84YY110 pKa = 10.56DD111 pKa = 3.4FSGASQYY118 pKa = 10.19NQNDD122 pKa = 3.39VQFTLDD128 pKa = 3.21AYY130 pKa = 10.61GVLLGAKK137 pKa = 9.49YY138 pKa = 8.67ATNVKK143 pKa = 10.29GPDD146 pKa = 3.53YY147 pKa = 10.89EE148 pKa = 5.19DD149 pKa = 5.33EE150 pKa = 4.47NGDD153 pKa = 3.78WQTGAQDD160 pKa = 3.7EE161 pKa = 4.61DD162 pKa = 3.97LASAFIGYY170 pKa = 7.65RR171 pKa = 11.84TLLPAEE177 pKa = 4.32IGFEE181 pKa = 3.77ARR183 pKa = 11.84YY184 pKa = 9.93EE185 pKa = 4.07YY186 pKa = 11.21VDD188 pKa = 3.69YY189 pKa = 10.99KK190 pKa = 11.53DD191 pKa = 3.72EE192 pKa = 4.29VFWNSDD198 pKa = 3.6FTSSRR203 pKa = 11.84SDD205 pKa = 3.38YY206 pKa = 10.96RR207 pKa = 11.84DD208 pKa = 2.99WEE210 pKa = 4.46VKK212 pKa = 8.59LTRR215 pKa = 11.84DD216 pKa = 3.52LLGVTWGLSYY226 pKa = 10.74IDD228 pKa = 3.81TDD230 pKa = 4.01LSKK233 pKa = 10.97SEE235 pKa = 4.57CVNFMGYY242 pKa = 10.77DD243 pKa = 3.85DD244 pKa = 4.52VCSATLVASASKK256 pKa = 9.63TFF258 pKa = 3.45
Molecular weight: 28.77 kDa
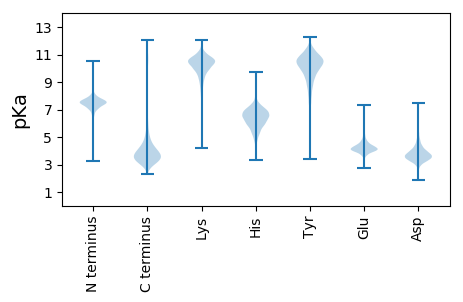
Isoelectric point according different methods:
Protein with the highest isoelectric point:
>tr|A0A257D260|A0A257D260_9PSED CDP-6-deoxy-delta-3 4-glucoseen reductase OS=Pseudomonas sp. PGPPP3 OX=2015555 GN=CFE49_11550 PE=4 SV=1
MM1 pKa = 7.45KK2 pKa = 9.56RR3 pKa = 11.84TFQPSTIKK11 pKa = 10.52RR12 pKa = 11.84ARR14 pKa = 11.84THH16 pKa = 5.94GFRR19 pKa = 11.84ARR21 pKa = 11.84MATKK25 pKa = 10.16NGRR28 pKa = 11.84AVLSRR33 pKa = 11.84RR34 pKa = 11.84RR35 pKa = 11.84AKK37 pKa = 9.94GRR39 pKa = 11.84KK40 pKa = 8.66RR41 pKa = 11.84LAVV44 pKa = 3.41
MM1 pKa = 7.45KK2 pKa = 9.56RR3 pKa = 11.84TFQPSTIKK11 pKa = 10.52RR12 pKa = 11.84ARR14 pKa = 11.84THH16 pKa = 5.94GFRR19 pKa = 11.84ARR21 pKa = 11.84MATKK25 pKa = 10.16NGRR28 pKa = 11.84AVLSRR33 pKa = 11.84RR34 pKa = 11.84RR35 pKa = 11.84AKK37 pKa = 9.94GRR39 pKa = 11.84KK40 pKa = 8.66RR41 pKa = 11.84LAVV44 pKa = 3.41
Molecular weight: 5.12 kDa
Isoelectric point according different methods:
Peptides (in silico digests for buttom-up proteomics)
Below you can find in silico digests of the whole proteome with Trypsin, Chymotrypsin, Trypsin+LysC, LysN, ArgC proteases suitable for different mass spec machines.| Try ESI |
 |
|---|
| ChTry ESI |
 |
|---|
| ArgC ESI |
 |
|---|
| LysN ESI |
 |
|---|
| TryLysC ESI |
 |
|---|
| Try MALDI |
 |
|---|
| ChTry MALDI |
 |
|---|
| ArgC MALDI |
 |
|---|
| LysN MALDI |
 |
|---|
| TryLysC MALDI |
 |
|---|
| Try LTQ |
 |
|---|
| ChTry LTQ |
 |
|---|
| ArgC LTQ |
 |
|---|
| LysN LTQ |
 |
|---|
| TryLysC LTQ |
 |
|---|
| Try MSlow |
 |
|---|
| ChTry MSlow |
 |
|---|
| ArgC MSlow |
 |
|---|
| LysN MSlow |
 |
|---|
| TryLysC MSlow |
 |
|---|
| Try MShigh |
 |
|---|
| ChTry MShigh |
 |
|---|
| ArgC MShigh |
 |
|---|
| LysN MShigh |
 |
|---|
| TryLysC MShigh |
 |
|---|
General Statistics
Number of major isoforms |
Number of additional isoforms |
Number of all proteins |
Number of amino acids |
Min. Seq. Length |
Max. Seq. Length |
Avg. Seq. Length |
Avg. Mol. Weight |
|---|---|---|---|---|---|---|---|
0 |
1019170 |
23 |
2240 |
269.3 |
29.5 |
Amino acid frequency
Ala |
Cys |
Asp |
Glu |
Phe |
Gly |
His |
Ile |
Lys |
Leu |
|---|---|---|---|---|---|---|---|---|---|
11.613 ± 0.053 | 1.066 ± 0.014 |
5.209 ± 0.03 | 5.672 ± 0.038 |
3.517 ± 0.026 | 7.74 ± 0.044 |
2.273 ± 0.023 | 4.502 ± 0.032 |
3.27 ± 0.033 | 12.588 ± 0.057 |
Met |
Asn |
Gln |
Pro |
Arg |
Ser |
Thr |
Val |
Trp |
Tyr |
|---|---|---|---|---|---|---|---|---|---|
2.188 ± 0.022 | 2.959 ± 0.027 |
4.815 ± 0.031 | 5.157 ± 0.04 |
6.367 ± 0.043 | 5.867 ± 0.033 |
4.462 ± 0.036 | 6.802 ± 0.037 |
1.439 ± 0.019 | 2.492 ± 0.022 |
Most of the basic statistics you can see at this page can be downloaded from this CSV file
Proteome-pI is available under Creative Commons Attribution-NoDerivs license, for more details see here
| Reference: Kozlowski LP. Proteome-pI 2.0: Proteome Isoelectric Point Database Update. Nucleic Acids Res. 2021, doi: 10.1093/nar/gkab944 | Contact: Lukasz P. Kozlowski |
