Roseomonas oryzae
Taxonomy: cellular organisms; Bacteria; Proteobacteria; Alphaproteobacteria; Rhodospirillales; Acetobacteraceae; Roseomonas
Average proteome isoelectric point is 6.97
Get precalculated fractions of proteins

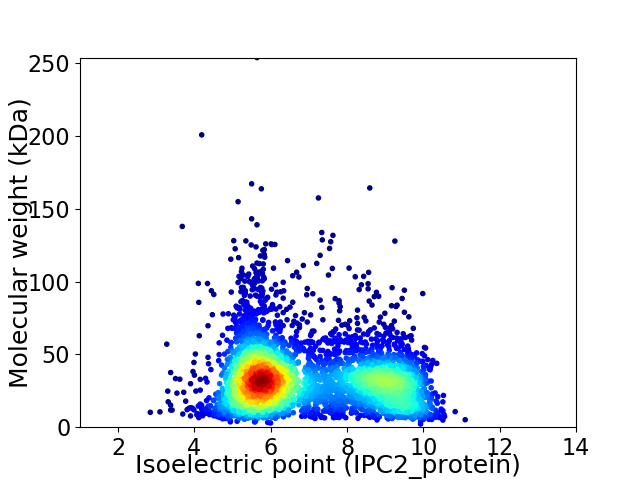
Virtual 2D-PAGE plot for 4202 proteins (isoelectric point calculated using IPC2_protein)
Get csv file with sequences according to given criteria:
* You can choose from 21 different methods for calculating isoelectric point
Summary statistics related to proteome-wise predictions


Protein with the lowest isoelectric point:
>tr|A0A5B2TB29|A0A5B2TB29_9PROT Uncharacterized protein OS=Roseomonas oryzae OX=1608942 GN=F0Q34_18735 PE=4 SV=1
MM1 pKa = 6.86LQVYY5 pKa = 7.49GTLRR9 pKa = 11.84LVFGWGGDD17 pKa = 3.67DD18 pKa = 4.17TITAEE23 pKa = 4.51APPGGIWGNVLFGGWGNDD41 pKa = 2.95TLTAIGDD48 pKa = 3.74RR49 pKa = 11.84NLVFGEE55 pKa = 4.71AGDD58 pKa = 3.8DD59 pKa = 3.99TITLRR64 pKa = 11.84GPLRR68 pKa = 11.84PEE70 pKa = 4.0PYY72 pKa = 10.16GGYY75 pKa = 10.03EE76 pKa = 4.32DD77 pKa = 5.35SLLNTAFGGAGNDD90 pKa = 3.46TLTSHH95 pKa = 6.46GFAATLRR102 pKa = 11.84GGAGSDD108 pKa = 3.33TLRR111 pKa = 11.84LDD113 pKa = 4.62GYY115 pKa = 9.2PGPGGYY121 pKa = 10.41AYY123 pKa = 10.36GDD125 pKa = 3.88EE126 pKa = 4.82GDD128 pKa = 5.3DD129 pKa = 4.09DD130 pKa = 5.11LSNVTDD136 pKa = 3.96GGVLDD141 pKa = 5.05GGAGADD147 pKa = 3.05IFYY150 pKa = 10.49GANFAFSPTTGAGTIMTGGSGADD173 pKa = 3.2KK174 pKa = 10.66FSLFGGGSYY183 pKa = 8.46TVEE186 pKa = 5.25DD187 pKa = 4.07YY188 pKa = 11.39SADD191 pKa = 3.54NRR193 pKa = 11.84LSAGDD198 pKa = 3.95TLTGLISVVTDD209 pKa = 3.83LQAEE213 pKa = 4.16DD214 pKa = 3.59SLYY217 pKa = 10.88FGNGLQLSDD226 pKa = 3.55RR227 pKa = 11.84FEE229 pKa = 5.72GEE231 pKa = 3.98VPLEE235 pKa = 4.16LGVPGYY241 pKa = 10.35SAGLQAILPLGGYY254 pKa = 8.78VAVKK258 pKa = 10.61GDD260 pKa = 3.97LFNPGMFDD268 pKa = 3.56VQEE271 pKa = 5.0DD272 pKa = 4.75GPDD275 pKa = 3.43LLLLFVEE282 pKa = 5.51RR283 pKa = 11.84YY284 pKa = 8.17IGRR287 pKa = 11.84PGGEE291 pKa = 4.02GPDD294 pKa = 3.63FQAASGAVALLDD306 pKa = 3.85YY307 pKa = 8.54TASTIPFAEE316 pKa = 4.3PFIVAA321 pKa = 4.56
MM1 pKa = 6.86LQVYY5 pKa = 7.49GTLRR9 pKa = 11.84LVFGWGGDD17 pKa = 3.67DD18 pKa = 4.17TITAEE23 pKa = 4.51APPGGIWGNVLFGGWGNDD41 pKa = 2.95TLTAIGDD48 pKa = 3.74RR49 pKa = 11.84NLVFGEE55 pKa = 4.71AGDD58 pKa = 3.8DD59 pKa = 3.99TITLRR64 pKa = 11.84GPLRR68 pKa = 11.84PEE70 pKa = 4.0PYY72 pKa = 10.16GGYY75 pKa = 10.03EE76 pKa = 4.32DD77 pKa = 5.35SLLNTAFGGAGNDD90 pKa = 3.46TLTSHH95 pKa = 6.46GFAATLRR102 pKa = 11.84GGAGSDD108 pKa = 3.33TLRR111 pKa = 11.84LDD113 pKa = 4.62GYY115 pKa = 9.2PGPGGYY121 pKa = 10.41AYY123 pKa = 10.36GDD125 pKa = 3.88EE126 pKa = 4.82GDD128 pKa = 5.3DD129 pKa = 4.09DD130 pKa = 5.11LSNVTDD136 pKa = 3.96GGVLDD141 pKa = 5.05GGAGADD147 pKa = 3.05IFYY150 pKa = 10.49GANFAFSPTTGAGTIMTGGSGADD173 pKa = 3.2KK174 pKa = 10.66FSLFGGGSYY183 pKa = 8.46TVEE186 pKa = 5.25DD187 pKa = 4.07YY188 pKa = 11.39SADD191 pKa = 3.54NRR193 pKa = 11.84LSAGDD198 pKa = 3.95TLTGLISVVTDD209 pKa = 3.83LQAEE213 pKa = 4.16DD214 pKa = 3.59SLYY217 pKa = 10.88FGNGLQLSDD226 pKa = 3.55RR227 pKa = 11.84FEE229 pKa = 5.72GEE231 pKa = 3.98VPLEE235 pKa = 4.16LGVPGYY241 pKa = 10.35SAGLQAILPLGGYY254 pKa = 8.78VAVKK258 pKa = 10.61GDD260 pKa = 3.97LFNPGMFDD268 pKa = 3.56VQEE271 pKa = 5.0DD272 pKa = 4.75GPDD275 pKa = 3.43LLLLFVEE282 pKa = 5.51RR283 pKa = 11.84YY284 pKa = 8.17IGRR287 pKa = 11.84PGGEE291 pKa = 4.02GPDD294 pKa = 3.63FQAASGAVALLDD306 pKa = 3.85YY307 pKa = 8.54TASTIPFAEE316 pKa = 4.3PFIVAA321 pKa = 4.56
Molecular weight: 32.94 kDa
Isoelectric point according different methods:
Protein with the highest isoelectric point:
>tr|A0A5B2TL10|A0A5B2TL10_9PROT NAD(P)/FAD-dependent oxidoreductase OS=Roseomonas oryzae OX=1608942 GN=F0Q34_05625 PE=4 SV=1
MM1 pKa = 7.35KK2 pKa = 9.43RR3 pKa = 11.84TYY5 pKa = 10.27QPSKK9 pKa = 9.73LVRR12 pKa = 11.84KK13 pKa = 9.02RR14 pKa = 11.84RR15 pKa = 11.84HH16 pKa = 4.44GFRR19 pKa = 11.84TRR21 pKa = 11.84MATVGGRR28 pKa = 11.84NVLANRR34 pKa = 11.84RR35 pKa = 11.84AKK37 pKa = 10.14GRR39 pKa = 11.84KK40 pKa = 8.82KK41 pKa = 10.63LSAA44 pKa = 3.95
MM1 pKa = 7.35KK2 pKa = 9.43RR3 pKa = 11.84TYY5 pKa = 10.27QPSKK9 pKa = 9.73LVRR12 pKa = 11.84KK13 pKa = 9.02RR14 pKa = 11.84RR15 pKa = 11.84HH16 pKa = 4.44GFRR19 pKa = 11.84TRR21 pKa = 11.84MATVGGRR28 pKa = 11.84NVLANRR34 pKa = 11.84RR35 pKa = 11.84AKK37 pKa = 10.14GRR39 pKa = 11.84KK40 pKa = 8.82KK41 pKa = 10.63LSAA44 pKa = 3.95
Molecular weight: 5.14 kDa
Isoelectric point according different methods:
Peptides (in silico digests for buttom-up proteomics)
Below you can find in silico digests of the whole proteome with Trypsin, Chymotrypsin, Trypsin+LysC, LysN, ArgC proteases suitable for different mass spec machines.| Try ESI |
 |
|---|
| ChTry ESI |
 |
|---|
| ArgC ESI |
 |
|---|
| LysN ESI |
 |
|---|
| TryLysC ESI |
 |
|---|
| Try MALDI |
 |
|---|
| ChTry MALDI |
 |
|---|
| ArgC MALDI |
 |
|---|
| LysN MALDI |
 |
|---|
| TryLysC MALDI |
 |
|---|
| Try LTQ |
 |
|---|
| ChTry LTQ |
 |
|---|
| ArgC LTQ |
 |
|---|
| LysN LTQ |
 |
|---|
| TryLysC LTQ |
 |
|---|
| Try MSlow |
 |
|---|
| ChTry MSlow |
 |
|---|
| ArgC MSlow |
 |
|---|
| LysN MSlow |
 |
|---|
| TryLysC MSlow |
 |
|---|
| Try MShigh |
 |
|---|
| ChTry MShigh |
 |
|---|
| ArgC MShigh |
 |
|---|
| LysN MShigh |
 |
|---|
| TryLysC MShigh |
 |
|---|
General Statistics
Number of major isoforms |
Number of additional isoforms |
Number of all proteins |
Number of amino acids |
Min. Seq. Length |
Max. Seq. Length |
Avg. Seq. Length |
Avg. Mol. Weight |
|---|---|---|---|---|---|---|---|
0 |
1378811 |
22 |
2458 |
328.1 |
35.26 |
Amino acid frequency
Ala |
Cys |
Asp |
Glu |
Phe |
Gly |
His |
Ile |
Lys |
Leu |
|---|---|---|---|---|---|---|---|---|---|
14.362 ± 0.065 | 0.855 ± 0.011 |
4.99 ± 0.025 | 5.59 ± 0.034 |
3.329 ± 0.022 | 9.368 ± 0.037 |
2.081 ± 0.016 | 4.125 ± 0.029 |
2.065 ± 0.026 | 11.239 ± 0.052 |
Met |
Asn |
Gln |
Pro |
Arg |
Ser |
Thr |
Val |
Trp |
Tyr |
|---|---|---|---|---|---|---|---|---|---|
2.474 ± 0.018 | 2.132 ± 0.02 |
6.23 ± 0.032 | 3.184 ± 0.021 |
8.289 ± 0.036 | 4.713 ± 0.024 |
4.657 ± 0.027 | 7.049 ± 0.03 |
1.483 ± 0.017 | 1.783 ± 0.017 |
Most of the basic statistics you can see at this page can be downloaded from this CSV file
Proteome-pI is available under Creative Commons Attribution-NoDerivs license, for more details see here
| Reference: Kozlowski LP. Proteome-pI 2.0: Proteome Isoelectric Point Database Update. Nucleic Acids Res. 2021, doi: 10.1093/nar/gkab944 | Contact: Lukasz P. Kozlowski |
