Enterobacteria phage cdtI
Taxonomy: Viruses; Duplodnaviria; Heunggongvirae; Uroviricota; Caudoviricetes; Caudovirales; Siphoviridae; unclassified Siphoviridae
Average proteome isoelectric point is 6.93
Get precalculated fractions of proteins

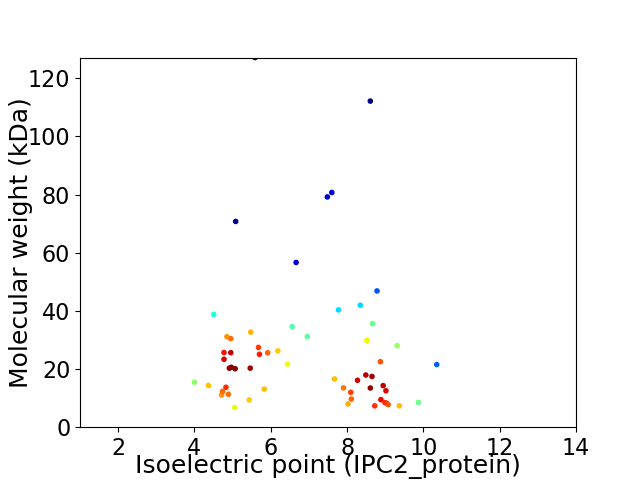
Virtual 2D-PAGE plot for 60 proteins (isoelectric point calculated using IPC2_protein)
Get csv file with sequences according to given criteria:
* You can choose from 21 different methods for calculating isoelectric point
Summary statistics related to proteome-wise predictions


Protein with the lowest isoelectric point:
>tr|A5LH35|A5LH35_9CAUD Putative major tail subunit OS=Enterobacteria phage cdtI OX=414970 PE=4 SV=1
MM1 pKa = 8.0ADD3 pKa = 3.13PMNRR7 pKa = 11.84HH8 pKa = 3.81TQIRR12 pKa = 11.84QVVLARR18 pKa = 11.84LRR20 pKa = 11.84EE21 pKa = 4.03QCGDD25 pKa = 3.08SATFFDD31 pKa = 4.77GLPAFVDD38 pKa = 3.93AQEE41 pKa = 4.51LPAVSVWLSDD51 pKa = 3.26AQYY54 pKa = 8.79TGKK57 pKa = 7.91MTDD60 pKa = 3.19EE61 pKa = 5.38DD62 pKa = 3.58DD63 pKa = 3.67WQAVLHH69 pKa = 5.99IAVFIRR75 pKa = 11.84AQAPDD80 pKa = 3.93SEE82 pKa = 5.25LDD84 pKa = 2.98MWMEE88 pKa = 4.06STIFPALNDD97 pKa = 3.5VPALSGLIDD106 pKa = 3.52TLIPLGFNYY115 pKa = 9.81QRR117 pKa = 11.84DD118 pKa = 3.81NEE120 pKa = 4.26MATWAMAEE128 pKa = 3.65ITYY131 pKa = 10.47QITYY135 pKa = 9.38TNN137 pKa = 3.43
MM1 pKa = 8.0ADD3 pKa = 3.13PMNRR7 pKa = 11.84HH8 pKa = 3.81TQIRR12 pKa = 11.84QVVLARR18 pKa = 11.84LRR20 pKa = 11.84EE21 pKa = 4.03QCGDD25 pKa = 3.08SATFFDD31 pKa = 4.77GLPAFVDD38 pKa = 3.93AQEE41 pKa = 4.51LPAVSVWLSDD51 pKa = 3.26AQYY54 pKa = 8.79TGKK57 pKa = 7.91MTDD60 pKa = 3.19EE61 pKa = 5.38DD62 pKa = 3.58DD63 pKa = 3.67WQAVLHH69 pKa = 5.99IAVFIRR75 pKa = 11.84AQAPDD80 pKa = 3.93SEE82 pKa = 5.25LDD84 pKa = 2.98MWMEE88 pKa = 4.06STIFPALNDD97 pKa = 3.5VPALSGLIDD106 pKa = 3.52TLIPLGFNYY115 pKa = 9.81QRR117 pKa = 11.84DD118 pKa = 3.81NEE120 pKa = 4.26MATWAMAEE128 pKa = 3.65ITYY131 pKa = 10.47QITYY135 pKa = 9.38TNN137 pKa = 3.43
Molecular weight: 15.48 kDa
Isoelectric point according different methods:
Protein with the highest isoelectric point:
>tr|A5LH47|A5LH47_9CAUD Phage_fiber_C domain-containing protein OS=Enterobacteria phage cdtI OX=414970 PE=4 SV=1
MM1 pKa = 7.73PFSSDD6 pKa = 2.76SRR8 pKa = 11.84MSAGPSRR15 pKa = 11.84SCAVSDD21 pKa = 4.36CPFSQSSCFPQPHH34 pKa = 6.64RR35 pKa = 11.84LCISFLKK42 pKa = 10.51IFMSFSTTACITAHH56 pKa = 7.17FIQSLNILPWPVTKK70 pKa = 10.16PDD72 pKa = 3.38LQMLKK77 pKa = 8.87KK78 pKa = 8.92TLNLCGIFGVKK89 pKa = 9.99KK90 pKa = 9.89GQSGDD95 pKa = 3.12EE96 pKa = 3.87CAICIRR102 pKa = 11.84EE103 pKa = 3.91PAIAVCLNNARR114 pKa = 11.84RR115 pKa = 11.84PQTKK119 pKa = 9.4TDD121 pKa = 3.18LCLPRR126 pKa = 11.84VALWSLRR133 pKa = 11.84SGCPHH138 pKa = 6.71RR139 pKa = 11.84ASRR142 pKa = 11.84TCFSFRR148 pKa = 11.84SLWACRR154 pKa = 11.84TCRR157 pKa = 11.84TGISLWTLWTCISRR171 pKa = 11.84QTGLSPLSPVAFRR184 pKa = 11.84PLRR187 pKa = 11.84ACRR190 pKa = 11.84TSITCRR196 pKa = 11.84SPLTGCPDD204 pKa = 3.29RR205 pKa = 11.84TGVATLSFISLRR217 pKa = 11.84PLRR220 pKa = 11.84TRR222 pKa = 11.84GPRR225 pKa = 11.84FSLWPGRR232 pKa = 11.84SHH234 pKa = 7.34HH235 pKa = 6.81GGDD238 pKa = 2.93SVYY241 pKa = 10.83GVFRR245 pKa = 11.84RR246 pKa = 11.84YY247 pKa = 8.8PALFRR252 pKa = 4.96
MM1 pKa = 7.73PFSSDD6 pKa = 2.76SRR8 pKa = 11.84MSAGPSRR15 pKa = 11.84SCAVSDD21 pKa = 4.36CPFSQSSCFPQPHH34 pKa = 6.64RR35 pKa = 11.84LCISFLKK42 pKa = 10.51IFMSFSTTACITAHH56 pKa = 7.17FIQSLNILPWPVTKK70 pKa = 10.16PDD72 pKa = 3.38LQMLKK77 pKa = 8.87KK78 pKa = 8.92TLNLCGIFGVKK89 pKa = 9.99KK90 pKa = 9.89GQSGDD95 pKa = 3.12EE96 pKa = 3.87CAICIRR102 pKa = 11.84EE103 pKa = 3.91PAIAVCLNNARR114 pKa = 11.84RR115 pKa = 11.84PQTKK119 pKa = 9.4TDD121 pKa = 3.18LCLPRR126 pKa = 11.84VALWSLRR133 pKa = 11.84SGCPHH138 pKa = 6.71RR139 pKa = 11.84ASRR142 pKa = 11.84TCFSFRR148 pKa = 11.84SLWACRR154 pKa = 11.84TCRR157 pKa = 11.84TGISLWTLWTCISRR171 pKa = 11.84QTGLSPLSPVAFRR184 pKa = 11.84PLRR187 pKa = 11.84ACRR190 pKa = 11.84TSITCRR196 pKa = 11.84SPLTGCPDD204 pKa = 3.29RR205 pKa = 11.84TGVATLSFISLRR217 pKa = 11.84PLRR220 pKa = 11.84TRR222 pKa = 11.84GPRR225 pKa = 11.84FSLWPGRR232 pKa = 11.84SHH234 pKa = 7.34HH235 pKa = 6.81GGDD238 pKa = 2.93SVYY241 pKa = 10.83GVFRR245 pKa = 11.84RR246 pKa = 11.84YY247 pKa = 8.8PALFRR252 pKa = 4.96
Molecular weight: 28.04 kDa
Isoelectric point according different methods:
Peptides (in silico digests for buttom-up proteomics)
Below you can find in silico digests of the whole proteome with Trypsin, Chymotrypsin, Trypsin+LysC, LysN, ArgC proteases suitable for different mass spec machines.| Try ESI |
 |
|---|
| ChTry ESI |
 |
|---|
| ArgC ESI |
 |
|---|
| LysN ESI |
 |
|---|
| TryLysC ESI |
 |
|---|
| Try MALDI |
 |
|---|
| ChTry MALDI |
 |
|---|
| ArgC MALDI |
 |
|---|
| LysN MALDI |
 |
|---|
| TryLysC MALDI |
 |
|---|
| Try LTQ |
 |
|---|
| ChTry LTQ |
 |
|---|
| ArgC LTQ |
 |
|---|
| LysN LTQ |
 |
|---|
| TryLysC LTQ |
 |
|---|
| Try MSlow |
 |
|---|
| ChTry MSlow |
 |
|---|
| ArgC MSlow |
 |
|---|
| LysN MSlow |
 |
|---|
| TryLysC MSlow |
 |
|---|
| Try MShigh |
 |
|---|
| ChTry MShigh |
 |
|---|
| ArgC MShigh |
 |
|---|
| LysN MShigh |
 |
|---|
| TryLysC MShigh |
 |
|---|
General Statistics
Number of major isoforms |
Number of additional isoforms |
Number of all proteins |
Number of amino acids |
Min. Seq. Length |
Max. Seq. Length |
Avg. Seq. Length |
Avg. Mol. Weight |
|---|---|---|---|---|---|---|---|
0 |
14607 |
59 |
1165 |
243.4 |
27.01 |
Amino acid frequency
Ala |
Cys |
Asp |
Glu |
Phe |
Gly |
His |
Ile |
Lys |
Leu |
|---|---|---|---|---|---|---|---|---|---|
9.153 ± 0.558 | 1.438 ± 0.223 |
5.744 ± 0.21 | 5.771 ± 0.279 |
3.574 ± 0.267 | 7.298 ± 0.398 |
1.842 ± 0.182 | 5.47 ± 0.397 |
5.292 ± 0.283 | 8.352 ± 0.357 |
Met |
Asn |
Gln |
Pro |
Arg |
Ser |
Thr |
Val |
Trp |
Tyr |
|---|---|---|---|---|---|---|---|---|---|
2.526 ± 0.144 | 4.457 ± 0.278 |
4.505 ± 0.303 | 4.176 ± 0.479 |
6.278 ± 0.354 | 7.038 ± 0.325 |
5.778 ± 0.404 | 6.723 ± 0.367 |
1.753 ± 0.177 | 2.834 ± 0.167 |
Most of the basic statistics you can see at this page can be downloaded from this CSV file
Proteome-pI is available under Creative Commons Attribution-NoDerivs license, for more details see here
| Reference: Kozlowski LP. Proteome-pI 2.0: Proteome Isoelectric Point Database Update. Nucleic Acids Res. 2021, doi: 10.1093/nar/gkab944 | Contact: Lukasz P. Kozlowski |
