Streptomyces sp. 769
Taxonomy: cellular organisms; Bacteria; Terrabacteria group; Actinobacteria; Actinomycetia; Streptomycetales; Streptomycetaceae; Streptomyces; unclassified Streptomyces
Average proteome isoelectric point is 6.75
Get precalculated fractions of proteins

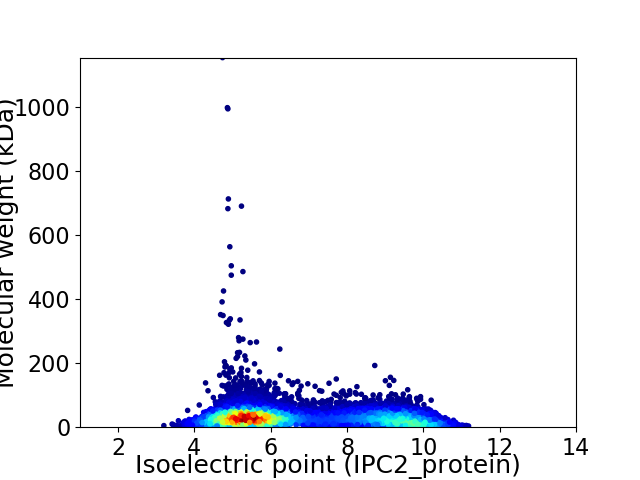
Virtual 2D-PAGE plot for 9427 proteins (isoelectric point calculated using IPC2_protein)
Get csv file with sequences according to given criteria:
* You can choose from 21 different methods for calculating isoelectric point
Summary statistics related to proteome-wise predictions


Protein with the lowest isoelectric point:
>tr|A0A0A8ERP4|A0A0A8ERP4_9ACTN Uncharacterized protein OS=Streptomyces sp. 769 OX=1262452 GN=GZL_04164 PE=4 SV=1
MM1 pKa = 7.83PEE3 pKa = 4.78DD4 pKa = 4.38LDD6 pKa = 4.91HH7 pKa = 7.87PEE9 pKa = 4.05QLWARR14 pKa = 11.84AATLAVVAAAMNDD27 pKa = 2.93GDD29 pKa = 4.31EE30 pKa = 4.42YY31 pKa = 11.26SWGPGGLACWNCGGSYY47 pKa = 7.22WWRR50 pKa = 11.84LKK52 pKa = 10.96LYY54 pKa = 10.57DD55 pKa = 4.71DD56 pKa = 5.29GRR58 pKa = 11.84ALLCGQDD65 pKa = 3.09SDD67 pKa = 4.79GSYY70 pKa = 8.53THH72 pKa = 6.84SGDD75 pKa = 3.44KK76 pKa = 10.89QIDD79 pKa = 3.8FLAGGPAWLPWEE91 pKa = 4.11QLRR94 pKa = 11.84DD95 pKa = 3.75DD96 pKa = 4.15AQGNLLGFAYY106 pKa = 9.38WYY108 pKa = 10.15EE109 pKa = 4.33DD110 pKa = 3.93GVWARR115 pKa = 11.84APYY118 pKa = 8.75PATMPDD124 pKa = 4.14DD125 pKa = 4.45GLEE128 pKa = 4.1MALGWAAPGDD138 pKa = 3.59AAVRR142 pKa = 11.84EE143 pKa = 4.45ITEE146 pKa = 4.06HH147 pKa = 6.64LVALTEE153 pKa = 4.36TDD155 pKa = 3.29VHH157 pKa = 5.9PAEE160 pKa = 4.31TVRR163 pKa = 11.84AFIASAAARR172 pKa = 11.84TVGAADD178 pKa = 3.53VFALLDD184 pKa = 3.86AVCGPDD190 pKa = 2.53CWYY193 pKa = 10.37EE194 pKa = 4.07VRR196 pKa = 11.84PEE198 pKa = 3.64AALAFAADD206 pKa = 4.27LGLTGDD212 pKa = 4.09RR213 pKa = 11.84GAVPAVASS221 pKa = 3.82
MM1 pKa = 7.83PEE3 pKa = 4.78DD4 pKa = 4.38LDD6 pKa = 4.91HH7 pKa = 7.87PEE9 pKa = 4.05QLWARR14 pKa = 11.84AATLAVVAAAMNDD27 pKa = 2.93GDD29 pKa = 4.31EE30 pKa = 4.42YY31 pKa = 11.26SWGPGGLACWNCGGSYY47 pKa = 7.22WWRR50 pKa = 11.84LKK52 pKa = 10.96LYY54 pKa = 10.57DD55 pKa = 4.71DD56 pKa = 5.29GRR58 pKa = 11.84ALLCGQDD65 pKa = 3.09SDD67 pKa = 4.79GSYY70 pKa = 8.53THH72 pKa = 6.84SGDD75 pKa = 3.44KK76 pKa = 10.89QIDD79 pKa = 3.8FLAGGPAWLPWEE91 pKa = 4.11QLRR94 pKa = 11.84DD95 pKa = 3.75DD96 pKa = 4.15AQGNLLGFAYY106 pKa = 9.38WYY108 pKa = 10.15EE109 pKa = 4.33DD110 pKa = 3.93GVWARR115 pKa = 11.84APYY118 pKa = 8.75PATMPDD124 pKa = 4.14DD125 pKa = 4.45GLEE128 pKa = 4.1MALGWAAPGDD138 pKa = 3.59AAVRR142 pKa = 11.84EE143 pKa = 4.45ITEE146 pKa = 4.06HH147 pKa = 6.64LVALTEE153 pKa = 4.36TDD155 pKa = 3.29VHH157 pKa = 5.9PAEE160 pKa = 4.31TVRR163 pKa = 11.84AFIASAAARR172 pKa = 11.84TVGAADD178 pKa = 3.53VFALLDD184 pKa = 3.86AVCGPDD190 pKa = 2.53CWYY193 pKa = 10.37EE194 pKa = 4.07VRR196 pKa = 11.84PEE198 pKa = 3.64AALAFAADD206 pKa = 4.27LGLTGDD212 pKa = 4.09RR213 pKa = 11.84GAVPAVASS221 pKa = 3.82
Molecular weight: 23.63 kDa
Isoelectric point according different methods:
Protein with the highest isoelectric point:
>tr|A0A0A8ELB6|A0A0A8ELB6_9ACTN Type II/IV secretion system protein OS=Streptomyces sp. 769 OX=1262452 GN=GZL_03666 PE=3 SV=1
MM1 pKa = 7.28SRR3 pKa = 11.84VGLVSRR9 pKa = 11.84VGRR12 pKa = 11.84AGGVSAGPPPRR23 pKa = 11.84RR24 pKa = 11.84RR25 pKa = 11.84RR26 pKa = 11.84SAARR30 pKa = 11.84RR31 pKa = 11.84AARR34 pKa = 11.84TT35 pKa = 3.46
MM1 pKa = 7.28SRR3 pKa = 11.84VGLVSRR9 pKa = 11.84VGRR12 pKa = 11.84AGGVSAGPPPRR23 pKa = 11.84RR24 pKa = 11.84RR25 pKa = 11.84RR26 pKa = 11.84SAARR30 pKa = 11.84RR31 pKa = 11.84AARR34 pKa = 11.84TT35 pKa = 3.46
Molecular weight: 3.67 kDa
Isoelectric point according different methods:
Peptides (in silico digests for buttom-up proteomics)
Below you can find in silico digests of the whole proteome with Trypsin, Chymotrypsin, Trypsin+LysC, LysN, ArgC proteases suitable for different mass spec machines.| Try ESI |
 |
|---|
| ChTry ESI |
 |
|---|
| ArgC ESI |
 |
|---|
| LysN ESI |
 |
|---|
| TryLysC ESI |
 |
|---|
| Try MALDI |
 |
|---|
| ChTry MALDI |
 |
|---|
| ArgC MALDI |
 |
|---|
| LysN MALDI |
 |
|---|
| TryLysC MALDI |
 |
|---|
| Try LTQ |
 |
|---|
| ChTry LTQ |
 |
|---|
| ArgC LTQ |
 |
|---|
| LysN LTQ |
 |
|---|
| TryLysC LTQ |
 |
|---|
| Try MSlow |
 |
|---|
| ChTry MSlow |
 |
|---|
| ArgC MSlow |
 |
|---|
| LysN MSlow |
 |
|---|
| TryLysC MSlow |
 |
|---|
| Try MShigh |
 |
|---|
| ChTry MShigh |
 |
|---|
| ArgC MShigh |
 |
|---|
| LysN MShigh |
 |
|---|
| TryLysC MShigh |
 |
|---|
General Statistics
Number of major isoforms |
Number of additional isoforms |
Number of all proteins |
Number of amino acids |
Min. Seq. Length |
Max. Seq. Length |
Avg. Seq. Length |
Avg. Mol. Weight |
|---|---|---|---|---|---|---|---|
0 |
2889423 |
29 |
11132 |
306.5 |
32.77 |
Amino acid frequency
Ala |
Cys |
Asp |
Glu |
Phe |
Gly |
His |
Ile |
Lys |
Leu |
|---|---|---|---|---|---|---|---|---|---|
14.077 ± 0.043 | 0.863 ± 0.008 |
5.874 ± 0.021 | 5.389 ± 0.025 |
2.648 ± 0.014 | 9.539 ± 0.026 |
2.538 ± 0.014 | 3.056 ± 0.019 |
1.976 ± 0.024 | 10.413 ± 0.035 |
Met |
Asn |
Gln |
Pro |
Arg |
Ser |
Thr |
Val |
Trp |
Tyr |
|---|---|---|---|---|---|---|---|---|---|
1.737 ± 0.012 | 1.67 ± 0.014 |
6.439 ± 0.028 | 2.871 ± 0.016 |
8.397 ± 0.031 | 4.82 ± 0.019 |
6.146 ± 0.025 | 8.098 ± 0.024 |
1.506 ± 0.012 | 1.943 ± 0.014 |
Most of the basic statistics you can see at this page can be downloaded from this CSV file
Proteome-pI is available under Creative Commons Attribution-NoDerivs license, for more details see here
| Reference: Kozlowski LP. Proteome-pI 2.0: Proteome Isoelectric Point Database Update. Nucleic Acids Res. 2021, doi: 10.1093/nar/gkab944 | Contact: Lukasz P. Kozlowski |
