Filimonas sp. YR581
Taxonomy: cellular organisms; Bacteria; FCB group; Bacteroidetes/Chlorobi group; Bacteroidetes; Chitinophagia; Chitinophagales; Chitinophagaceae; Filimonas; unclassified Filimonas
Average proteome isoelectric point is 6.9
Get precalculated fractions of proteins

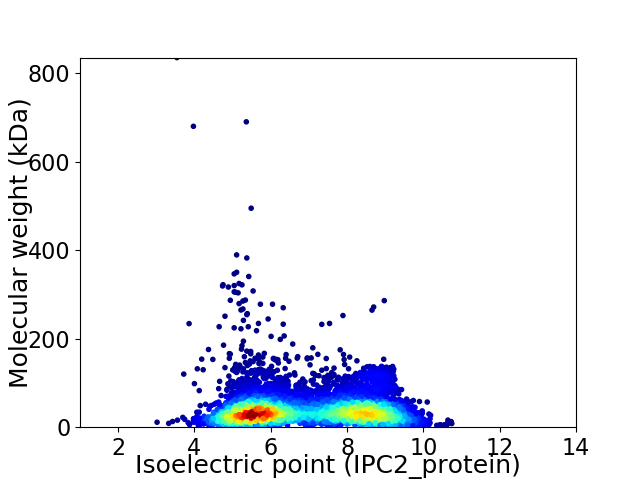
Virtual 2D-PAGE plot for 6102 proteins (isoelectric point calculated using IPC2_protein)
Get csv file with sequences according to given criteria:
* You can choose from 21 different methods for calculating isoelectric point
Summary statistics related to proteome-wise predictions


Protein with the lowest isoelectric point:
>tr|A0A2U0ZR09|A0A2U0ZR09_9BACT 50S ribosomal protein L15 OS=Filimonas sp. YR581 OX=2135469 GN=rplO PE=3 SV=1
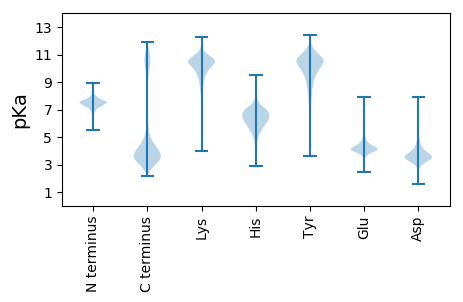
MM1 pKa = 7.4EE2 pKa = 5.76RR3 pKa = 11.84LLAKK7 pKa = 10.35KK8 pKa = 10.31GIEE11 pKa = 3.77LVSYY15 pKa = 10.62INEE18 pKa = 4.43DD19 pKa = 3.51GAKK22 pKa = 9.68VSYY25 pKa = 11.11AFTEE29 pKa = 4.24EE30 pKa = 4.13MLKK33 pKa = 9.64QQIVVVLTEE42 pKa = 4.84ASGDD46 pKa = 3.14WYY48 pKa = 11.19YY49 pKa = 11.48DD50 pKa = 3.62SEE52 pKa = 4.41EE53 pKa = 3.87EE54 pKa = 4.19AYY56 pKa = 10.18EE57 pKa = 4.21EE58 pKa = 4.13EE59 pKa = 4.59EE60 pKa = 3.98EE61 pKa = 4.33WEE63 pKa = 4.14EE64 pKa = 4.05TEE66 pKa = 4.23EE67 pKa = 4.51AEE69 pKa = 4.94EE70 pKa = 4.14EE71 pKa = 4.01ADD73 pKa = 4.07EE74 pKa = 4.11EE75 pKa = 4.98AEE77 pKa = 4.21AHH79 pKa = 6.64DD80 pKa = 4.53EE81 pKa = 4.11EE82 pKa = 6.53DD83 pKa = 3.84GEE85 pKa = 4.44EE86 pKa = 4.08IEE88 pKa = 4.41MEE90 pKa = 4.1GWDD93 pKa = 4.37DD94 pKa = 3.58EE95 pKa = 4.82SAAEE99 pKa = 3.93TTIAVVFTKK108 pKa = 10.93DD109 pKa = 2.97NIAYY113 pKa = 9.79DD114 pKa = 3.49FTICVDD120 pKa = 3.94DD121 pKa = 5.03RR122 pKa = 11.84PVIPLIYY129 pKa = 9.77LYY131 pKa = 10.87GIIKK135 pKa = 9.94EE136 pKa = 4.13LVDD139 pKa = 5.06IITASDD145 pKa = 3.36TANFIDD151 pKa = 5.0DD152 pKa = 4.86LGDD155 pKa = 3.2IATGMGASNEE165 pKa = 4.02FEE167 pKa = 4.45EE168 pKa = 5.85DD169 pKa = 4.19PEE171 pKa = 4.47FCDD174 pKa = 3.22YY175 pKa = 11.15LYY177 pKa = 11.47NLGVEE182 pKa = 4.69HH183 pKa = 7.09LAKK186 pKa = 10.39AASLLQEE193 pKa = 4.48KK194 pKa = 10.48KK195 pKa = 10.21SS196 pKa = 3.52
MM1 pKa = 7.4EE2 pKa = 5.76RR3 pKa = 11.84LLAKK7 pKa = 10.35KK8 pKa = 10.31GIEE11 pKa = 3.77LVSYY15 pKa = 10.62INEE18 pKa = 4.43DD19 pKa = 3.51GAKK22 pKa = 9.68VSYY25 pKa = 11.11AFTEE29 pKa = 4.24EE30 pKa = 4.13MLKK33 pKa = 9.64QQIVVVLTEE42 pKa = 4.84ASGDD46 pKa = 3.14WYY48 pKa = 11.19YY49 pKa = 11.48DD50 pKa = 3.62SEE52 pKa = 4.41EE53 pKa = 3.87EE54 pKa = 4.19AYY56 pKa = 10.18EE57 pKa = 4.21EE58 pKa = 4.13EE59 pKa = 4.59EE60 pKa = 3.98EE61 pKa = 4.33WEE63 pKa = 4.14EE64 pKa = 4.05TEE66 pKa = 4.23EE67 pKa = 4.51AEE69 pKa = 4.94EE70 pKa = 4.14EE71 pKa = 4.01ADD73 pKa = 4.07EE74 pKa = 4.11EE75 pKa = 4.98AEE77 pKa = 4.21AHH79 pKa = 6.64DD80 pKa = 4.53EE81 pKa = 4.11EE82 pKa = 6.53DD83 pKa = 3.84GEE85 pKa = 4.44EE86 pKa = 4.08IEE88 pKa = 4.41MEE90 pKa = 4.1GWDD93 pKa = 4.37DD94 pKa = 3.58EE95 pKa = 4.82SAAEE99 pKa = 3.93TTIAVVFTKK108 pKa = 10.93DD109 pKa = 2.97NIAYY113 pKa = 9.79DD114 pKa = 3.49FTICVDD120 pKa = 3.94DD121 pKa = 5.03RR122 pKa = 11.84PVIPLIYY129 pKa = 9.77LYY131 pKa = 10.87GIIKK135 pKa = 9.94EE136 pKa = 4.13LVDD139 pKa = 5.06IITASDD145 pKa = 3.36TANFIDD151 pKa = 5.0DD152 pKa = 4.86LGDD155 pKa = 3.2IATGMGASNEE165 pKa = 4.02FEE167 pKa = 4.45EE168 pKa = 5.85DD169 pKa = 4.19PEE171 pKa = 4.47FCDD174 pKa = 3.22YY175 pKa = 11.15LYY177 pKa = 11.47NLGVEE182 pKa = 4.69HH183 pKa = 7.09LAKK186 pKa = 10.39AASLLQEE193 pKa = 4.48KK194 pKa = 10.48KK195 pKa = 10.21SS196 pKa = 3.52
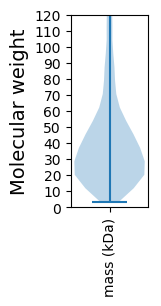
Molecular weight: 22.19 kDa
Isoelectric point according different methods:
Protein with the highest isoelectric point:
>tr|A0A2U0ZD87|A0A2U0ZD87_9BACT Indole-3-glycerol-phosphate synthase OS=Filimonas sp. YR581 OX=2135469 GN=C7485_11020 PE=4 SV=1
MM1 pKa = 7.38QSFLSGSRR9 pKa = 11.84VCVVNRR15 pKa = 11.84CFIRR19 pKa = 11.84VFTIHH24 pKa = 5.29SQKK27 pKa = 11.06NIGKK31 pKa = 9.85AGRR34 pKa = 11.84LLMFATEE41 pKa = 3.8WFLNKK46 pKa = 8.8RR47 pKa = 11.84TNYY50 pKa = 9.38EE51 pKa = 4.32SKK53 pKa = 11.05NSICVMPVNRR63 pKa = 11.84FVVYY67 pKa = 10.59
MM1 pKa = 7.38QSFLSGSRR9 pKa = 11.84VCVVNRR15 pKa = 11.84CFIRR19 pKa = 11.84VFTIHH24 pKa = 5.29SQKK27 pKa = 11.06NIGKK31 pKa = 9.85AGRR34 pKa = 11.84LLMFATEE41 pKa = 3.8WFLNKK46 pKa = 8.8RR47 pKa = 11.84TNYY50 pKa = 9.38EE51 pKa = 4.32SKK53 pKa = 11.05NSICVMPVNRR63 pKa = 11.84FVVYY67 pKa = 10.59
Molecular weight: 7.84 kDa
Isoelectric point according different methods:
Peptides (in silico digests for buttom-up proteomics)
Below you can find in silico digests of the whole proteome with Trypsin, Chymotrypsin, Trypsin+LysC, LysN, ArgC proteases suitable for different mass spec machines.| Try ESI |
 |
|---|
| ChTry ESI |
 |
|---|
| ArgC ESI |
 |
|---|
| LysN ESI |
 |
|---|
| TryLysC ESI |
 |
|---|
| Try MALDI |
 |
|---|
| ChTry MALDI |
 |
|---|
| ArgC MALDI |
 |
|---|
| LysN MALDI |
 |
|---|
| TryLysC MALDI |
 |
|---|
| Try LTQ |
 |
|---|
| ChTry LTQ |
 |
|---|
| ArgC LTQ |
 |
|---|
| LysN LTQ |
 |
|---|
| TryLysC LTQ |
 |
|---|
| Try MSlow |
 |
|---|
| ChTry MSlow |
 |
|---|
| ArgC MSlow |
 |
|---|
| LysN MSlow |
 |
|---|
| TryLysC MSlow |
 |
|---|
| Try MShigh |
 |
|---|
| ChTry MShigh |
 |
|---|
| ArgC MShigh |
 |
|---|
| LysN MShigh |
 |
|---|
| TryLysC MShigh |
 |
|---|
General Statistics
Number of major isoforms |
Number of additional isoforms |
Number of all proteins |
Number of amino acids |
Min. Seq. Length |
Max. Seq. Length |
Avg. Seq. Length |
Avg. Mol. Weight |
|---|---|---|---|---|---|---|---|
0 |
2383604 |
29 |
8160 |
390.6 |
43.47 |
Amino acid frequency
Ala |
Cys |
Asp |
Glu |
Phe |
Gly |
His |
Ile |
Lys |
Leu |
|---|---|---|---|---|---|---|---|---|---|
8.744 ± 0.041 | 0.899 ± 0.01 |
4.897 ± 0.024 | 5.164 ± 0.036 |
4.435 ± 0.022 | 7.062 ± 0.032 |
1.902 ± 0.016 | 6.174 ± 0.027 |
5.9 ± 0.033 | 9.401 ± 0.04 |
Met |
Asn |
Gln |
Pro |
Arg |
Ser |
Thr |
Val |
Trp |
Tyr |
|---|---|---|---|---|---|---|---|---|---|
2.255 ± 0.016 | 5.329 ± 0.032 |
3.965 ± 0.02 | 4.238 ± 0.022 |
4.208 ± 0.02 | 6.251 ± 0.03 |
6.589 ± 0.055 | 6.874 ± 0.032 |
1.327 ± 0.012 | 4.384 ± 0.022 |
Most of the basic statistics you can see at this page can be downloaded from this CSV file
Proteome-pI is available under Creative Commons Attribution-NoDerivs license, for more details see here
| Reference: Kozlowski LP. Proteome-pI 2.0: Proteome Isoelectric Point Database Update. Nucleic Acids Res. 2021, doi: 10.1093/nar/gkab944 | Contact: Lukasz P. Kozlowski |
