Human papillomavirus 31
Taxonomy: Viruses; Monodnaviria; Shotokuvirae; Cossaviricota; Papovaviricetes; Zurhausenvirales; Papillomaviridae; Firstpapillomavirinae; Alphapapillomavirus; Alphapapillomavirus 9
Average proteome isoelectric point is 6.97
Get precalculated fractions of proteins

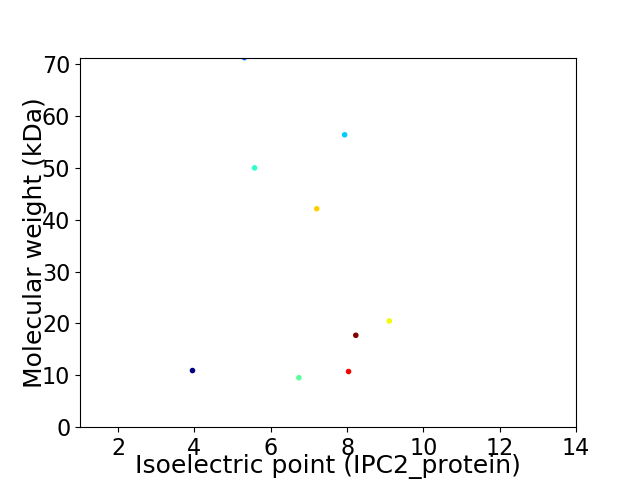
Virtual 2D-PAGE plot for 9 proteins (isoelectric point calculated using IPC2_protein)
Get csv file with sequences according to given criteria:
* You can choose from 21 different methods for calculating isoelectric point
Summary statistics related to proteome-wise predictions


Protein with the lowest isoelectric point:
>sp|P17388|VL1_HPV31 Major capsid protein L1 OS=Human papillomavirus 31 OX=10585 GN=L1 PE=3 SV=1
MM1 pKa = 7.69RR2 pKa = 11.84GEE4 pKa = 4.29TPTLQDD10 pKa = 3.63YY11 pKa = 11.26VLDD14 pKa = 4.34LQPEE18 pKa = 4.33ATDD21 pKa = 3.2LHH23 pKa = 8.23CYY25 pKa = 8.12EE26 pKa = 4.67QLPDD30 pKa = 3.69SSDD33 pKa = 3.54EE34 pKa = 4.06EE35 pKa = 4.5DD36 pKa = 5.04VIDD39 pKa = 4.58SPAGQAEE46 pKa = 4.66PDD48 pKa = 3.34TSNYY52 pKa = 10.56NIVTFCCQCKK62 pKa = 8.79STLRR66 pKa = 11.84LCVQSTQVDD75 pKa = 3.23IRR77 pKa = 11.84ILQEE81 pKa = 3.71LLMGSFGIVCPNCSTRR97 pKa = 11.84LL98 pKa = 3.52
MM1 pKa = 7.69RR2 pKa = 11.84GEE4 pKa = 4.29TPTLQDD10 pKa = 3.63YY11 pKa = 11.26VLDD14 pKa = 4.34LQPEE18 pKa = 4.33ATDD21 pKa = 3.2LHH23 pKa = 8.23CYY25 pKa = 8.12EE26 pKa = 4.67QLPDD30 pKa = 3.69SSDD33 pKa = 3.54EE34 pKa = 4.06EE35 pKa = 4.5DD36 pKa = 5.04VIDD39 pKa = 4.58SPAGQAEE46 pKa = 4.66PDD48 pKa = 3.34TSNYY52 pKa = 10.56NIVTFCCQCKK62 pKa = 8.79STLRR66 pKa = 11.84LCVQSTQVDD75 pKa = 3.23IRR77 pKa = 11.84ILQEE81 pKa = 3.71LLMGSFGIVCPNCSTRR97 pKa = 11.84LL98 pKa = 3.52
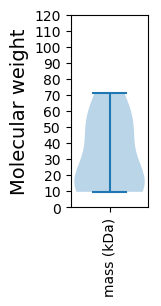
Molecular weight: 10.92 kDa
Isoelectric point according different methods:
Protein with the highest isoelectric point:
>sp|P17382|VE1_HPV31 Replication protein E1 OS=Human papillomavirus 31 OX=10585 GN=E1 PE=3 SV=1
MM1 pKa = 7.97AILKK5 pKa = 8.26WKK7 pKa = 9.46RR8 pKa = 11.84SRR10 pKa = 11.84WYY12 pKa = 10.55SSDD15 pKa = 3.49EE16 pKa = 3.64ISFAGIVTKK25 pKa = 10.84LPTANNTTTSNSKK38 pKa = 8.32TCALGTSEE46 pKa = 4.19GVRR49 pKa = 11.84RR50 pKa = 11.84ATTSTKK56 pKa = 10.25RR57 pKa = 11.84PRR59 pKa = 11.84TEE61 pKa = 3.66PEE63 pKa = 3.66HH64 pKa = 7.13RR65 pKa = 11.84NTHH68 pKa = 5.97HH69 pKa = 6.85PNKK72 pKa = 10.03LLRR75 pKa = 11.84GDD77 pKa = 3.86SVDD80 pKa = 3.63SVNCGVISAAACTNQTRR97 pKa = 11.84AVSCPATTPIIHH109 pKa = 6.96LKK111 pKa = 10.46GDD113 pKa = 3.83ANILKK118 pKa = 9.85CLRR121 pKa = 11.84YY122 pKa = 9.59RR123 pKa = 11.84LSKK126 pKa = 10.72YY127 pKa = 8.93KK128 pKa = 10.22QLYY131 pKa = 8.14EE132 pKa = 4.15QVSSTWHH139 pKa = 4.39WTCTDD144 pKa = 3.55GKK146 pKa = 9.52HH147 pKa = 5.91KK148 pKa = 10.72NAIVTLTYY156 pKa = 10.47ISTSQRR162 pKa = 11.84DD163 pKa = 3.63DD164 pKa = 3.61FLNTVKK170 pKa = 10.39IPNTVSVSTGYY181 pKa = 7.77MTII184 pKa = 3.68
MM1 pKa = 7.97AILKK5 pKa = 8.26WKK7 pKa = 9.46RR8 pKa = 11.84SRR10 pKa = 11.84WYY12 pKa = 10.55SSDD15 pKa = 3.49EE16 pKa = 3.64ISFAGIVTKK25 pKa = 10.84LPTANNTTTSNSKK38 pKa = 8.32TCALGTSEE46 pKa = 4.19GVRR49 pKa = 11.84RR50 pKa = 11.84ATTSTKK56 pKa = 10.25RR57 pKa = 11.84PRR59 pKa = 11.84TEE61 pKa = 3.66PEE63 pKa = 3.66HH64 pKa = 7.13RR65 pKa = 11.84NTHH68 pKa = 5.97HH69 pKa = 6.85PNKK72 pKa = 10.03LLRR75 pKa = 11.84GDD77 pKa = 3.86SVDD80 pKa = 3.63SVNCGVISAAACTNQTRR97 pKa = 11.84AVSCPATTPIIHH109 pKa = 6.96LKK111 pKa = 10.46GDD113 pKa = 3.83ANILKK118 pKa = 9.85CLRR121 pKa = 11.84YY122 pKa = 9.59RR123 pKa = 11.84LSKK126 pKa = 10.72YY127 pKa = 8.93KK128 pKa = 10.22QLYY131 pKa = 8.14EE132 pKa = 4.15QVSSTWHH139 pKa = 4.39WTCTDD144 pKa = 3.55GKK146 pKa = 9.52HH147 pKa = 5.91KK148 pKa = 10.72NAIVTLTYY156 pKa = 10.47ISTSQRR162 pKa = 11.84DD163 pKa = 3.63DD164 pKa = 3.61FLNTVKK170 pKa = 10.39IPNTVSVSTGYY181 pKa = 7.77MTII184 pKa = 3.68
Molecular weight: 20.47 kDa
Isoelectric point according different methods:
Peptides (in silico digests for buttom-up proteomics)
Below you can find in silico digests of the whole proteome with Trypsin, Chymotrypsin, Trypsin+LysC, LysN, ArgC proteases suitable for different mass spec machines.| Try ESI |
 |
|---|
| ChTry ESI |
 |
|---|
| ArgC ESI |
 |
|---|
| LysN ESI |
 |
|---|
| TryLysC ESI |
 |
|---|
| Try MALDI |
 |
|---|
| ChTry MALDI |
 |
|---|
| ArgC MALDI |
 |
|---|
| LysN MALDI |
 |
|---|
| TryLysC MALDI |
 |
|---|
| Try LTQ |
 |
|---|
| ChTry LTQ |
 |
|---|
| ArgC LTQ |
 |
|---|
| LysN LTQ |
 |
|---|
| TryLysC LTQ |
 |
|---|
| Try MSlow |
 |
|---|
| ChTry MSlow |
 |
|---|
| ArgC MSlow |
 |
|---|
| LysN MSlow |
 |
|---|
| TryLysC MSlow |
 |
|---|
| Try MShigh |
 |
|---|
| ChTry MShigh |
 |
|---|
| ArgC MShigh |
 |
|---|
| LysN MShigh |
 |
|---|
| TryLysC MShigh |
 |
|---|
General Statistics
Number of major isoforms |
Number of additional isoforms |
Number of all proteins |
Number of amino acids |
Min. Seq. Length |
Max. Seq. Length |
Avg. Seq. Length |
Avg. Mol. Weight |
|---|---|---|---|---|---|---|---|
0 |
2585 |
84 |
629 |
287.2 |
32.11 |
Amino acid frequency
Ala |
Cys |
Asp |
Glu |
Phe |
Gly |
His |
Ile |
Lys |
Leu |
|---|---|---|---|---|---|---|---|---|---|
5.764 ± 0.463 | 3.172 ± 0.674 |
5.261 ± 0.541 | 4.72 ± 0.567 |
3.791 ± 0.545 | 5.571 ± 0.45 |
2.476 ± 0.402 | 5.377 ± 0.537 |
5.455 ± 0.768 | 8.162 ± 0.827 |
Met |
Asn |
Gln |
Pro |
Arg |
Ser |
Thr |
Val |
Trp |
Tyr |
|---|---|---|---|---|---|---|---|---|---|
1.896 ± 0.306 | 4.565 ± 0.57 |
5.841 ± 1.094 | 3.985 ± 0.51 |
4.758 ± 0.469 | 8.24 ± 0.705 |
9.091 ± 1.075 | 6.576 ± 0.502 |
1.393 ± 0.311 | 3.907 ± 0.212 |
Most of the basic statistics you can see at this page can be downloaded from this CSV file
Proteome-pI is available under Creative Commons Attribution-NoDerivs license, for more details see here
| Reference: Kozlowski LP. Proteome-pI 2.0: Proteome Isoelectric Point Database Update. Nucleic Acids Res. 2021, doi: 10.1093/nar/gkab944 | Contact: Lukasz P. Kozlowski |
