Ketobacter alkanivorans
Taxonomy: cellular organisms; Bacteria; Proteobacteria; Gammaproteobacteria; Oceanospirillales; Alcanivoracaceae; Ketobacter
Average proteome isoelectric point is 6.02
Get precalculated fractions of proteins

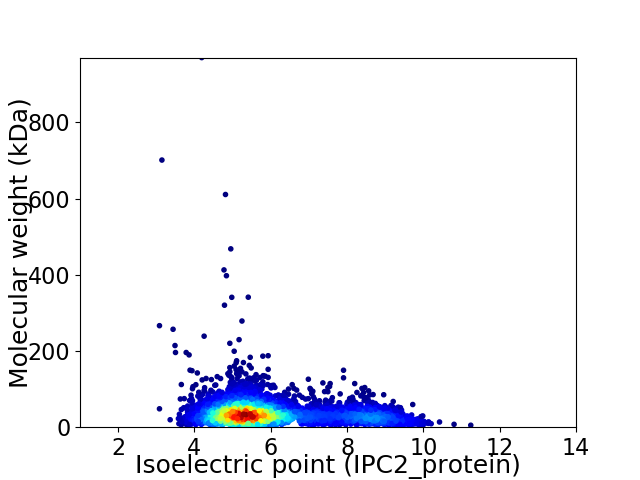
Virtual 2D-PAGE plot for 4119 proteins (isoelectric point calculated using IPC2_protein)
Get csv file with sequences according to given criteria:
* You can choose from 21 different methods for calculating isoelectric point
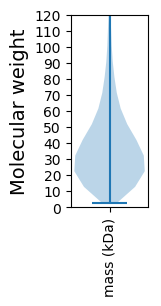
Summary statistics related to proteome-wise predictions


Protein with the lowest isoelectric point:
>tr|A0A2K9LG39|A0A2K9LG39_9GAMM AAA family ATPase OS=Ketobacter alkanivorans OX=1917421 GN=Kalk_01575 PE=4 SV=1
MM1 pKa = 7.25EE2 pKa = 4.86AQVAASLYY10 pKa = 10.48KK11 pKa = 10.48DD12 pKa = 3.36GRR14 pKa = 11.84KK15 pKa = 8.69QALVGGDD22 pKa = 3.08IVVASSDD29 pKa = 3.79SGLHH33 pKa = 5.32SSILRR38 pKa = 11.84SIEE41 pKa = 3.91NLGGDD46 pKa = 4.45YY47 pKa = 10.42IANIQVDD54 pKa = 3.72DD55 pKa = 4.11SGQGVEE61 pKa = 4.9FAVEE65 pKa = 4.13HH66 pKa = 6.94DD67 pKa = 3.86PVAARR72 pKa = 11.84EE73 pKa = 4.08DD74 pKa = 2.72RR75 pKa = 11.84WYY77 pKa = 10.15PVDD80 pKa = 4.36EE81 pKa = 4.74LLVDD85 pKa = 4.54PGPGEE90 pKa = 3.92LVGYY94 pKa = 10.37AFDD97 pKa = 3.96VNFPSEE103 pKa = 4.07IMLTSPLPTDD113 pKa = 4.1TYY115 pKa = 9.88TSRR118 pKa = 11.84GQTIALNWNTEE129 pKa = 4.16TNGDD133 pKa = 4.05QIRR136 pKa = 11.84LTSVQTCFSGDD147 pKa = 3.64QSVQWATSTIINSTDD162 pKa = 3.23TGSHH166 pKa = 6.94DD167 pKa = 3.32ISVGSLIPSTTVVNAISDD185 pKa = 4.15FFQQISVMIVSSVLEE200 pKa = 4.58AYY202 pKa = 9.06TFGLVSADD210 pKa = 4.63DD211 pKa = 4.12IDD213 pKa = 4.41LGSYY217 pKa = 9.91NLDD220 pKa = 3.32YY221 pKa = 10.43CTISLTVFRR230 pKa = 11.84EE231 pKa = 3.66ISNDD235 pKa = 3.14LGADD239 pKa = 2.97ISGGYY244 pKa = 10.31AIGSASDD251 pKa = 3.62TVTVRR256 pKa = 11.84YY257 pKa = 9.43EE258 pKa = 3.67PP259 pKa = 4.0
MM1 pKa = 7.25EE2 pKa = 4.86AQVAASLYY10 pKa = 10.48KK11 pKa = 10.48DD12 pKa = 3.36GRR14 pKa = 11.84KK15 pKa = 8.69QALVGGDD22 pKa = 3.08IVVASSDD29 pKa = 3.79SGLHH33 pKa = 5.32SSILRR38 pKa = 11.84SIEE41 pKa = 3.91NLGGDD46 pKa = 4.45YY47 pKa = 10.42IANIQVDD54 pKa = 3.72DD55 pKa = 4.11SGQGVEE61 pKa = 4.9FAVEE65 pKa = 4.13HH66 pKa = 6.94DD67 pKa = 3.86PVAARR72 pKa = 11.84EE73 pKa = 4.08DD74 pKa = 2.72RR75 pKa = 11.84WYY77 pKa = 10.15PVDD80 pKa = 4.36EE81 pKa = 4.74LLVDD85 pKa = 4.54PGPGEE90 pKa = 3.92LVGYY94 pKa = 10.37AFDD97 pKa = 3.96VNFPSEE103 pKa = 4.07IMLTSPLPTDD113 pKa = 4.1TYY115 pKa = 9.88TSRR118 pKa = 11.84GQTIALNWNTEE129 pKa = 4.16TNGDD133 pKa = 4.05QIRR136 pKa = 11.84LTSVQTCFSGDD147 pKa = 3.64QSVQWATSTIINSTDD162 pKa = 3.23TGSHH166 pKa = 6.94DD167 pKa = 3.32ISVGSLIPSTTVVNAISDD185 pKa = 4.15FFQQISVMIVSSVLEE200 pKa = 4.58AYY202 pKa = 9.06TFGLVSADD210 pKa = 4.63DD211 pKa = 4.12IDD213 pKa = 4.41LGSYY217 pKa = 9.91NLDD220 pKa = 3.32YY221 pKa = 10.43CTISLTVFRR230 pKa = 11.84EE231 pKa = 3.66ISNDD235 pKa = 3.14LGADD239 pKa = 2.97ISGGYY244 pKa = 10.31AIGSASDD251 pKa = 3.62TVTVRR256 pKa = 11.84YY257 pKa = 9.43EE258 pKa = 3.67PP259 pKa = 4.0
Molecular weight: 27.69 kDa
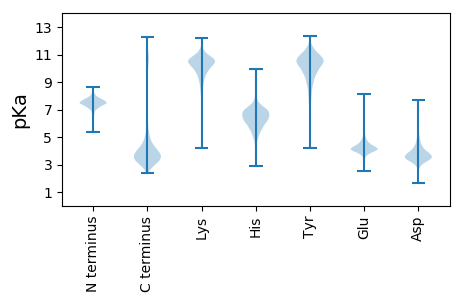
Isoelectric point according different methods:
Protein with the highest isoelectric point:
>tr|A0A2K9LL68|A0A2K9LL68_9GAMM Primosomal protein N' OS=Ketobacter alkanivorans OX=1917421 GN=priA PE=3 SV=1
MM1 pKa = 7.45KK2 pKa = 9.61RR3 pKa = 11.84TFQPSNLKK11 pKa = 10.16RR12 pKa = 11.84KK13 pKa = 9.08RR14 pKa = 11.84NHH16 pKa = 5.37GFRR19 pKa = 11.84ARR21 pKa = 11.84MATKK25 pKa = 10.38GGRR28 pKa = 11.84QVLARR33 pKa = 11.84RR34 pKa = 11.84RR35 pKa = 11.84AKK37 pKa = 10.25GRR39 pKa = 11.84QRR41 pKa = 11.84LSAA44 pKa = 4.04
MM1 pKa = 7.45KK2 pKa = 9.61RR3 pKa = 11.84TFQPSNLKK11 pKa = 10.16RR12 pKa = 11.84KK13 pKa = 9.08RR14 pKa = 11.84NHH16 pKa = 5.37GFRR19 pKa = 11.84ARR21 pKa = 11.84MATKK25 pKa = 10.38GGRR28 pKa = 11.84QVLARR33 pKa = 11.84RR34 pKa = 11.84RR35 pKa = 11.84AKK37 pKa = 10.25GRR39 pKa = 11.84QRR41 pKa = 11.84LSAA44 pKa = 4.04
Molecular weight: 5.18 kDa
Isoelectric point according different methods:
Peptides (in silico digests for buttom-up proteomics)
Below you can find in silico digests of the whole proteome with Trypsin, Chymotrypsin, Trypsin+LysC, LysN, ArgC proteases suitable for different mass spec machines.| Try ESI |
 |
|---|
| ChTry ESI |
 |
|---|
| ArgC ESI |
 |
|---|
| LysN ESI |
 |
|---|
| TryLysC ESI |
 |
|---|
| Try MALDI |
 |
|---|
| ChTry MALDI |
 |
|---|
| ArgC MALDI |
 |
|---|
| LysN MALDI |
 |
|---|
| TryLysC MALDI |
 |
|---|
| Try LTQ |
 |
|---|
| ChTry LTQ |
 |
|---|
| ArgC LTQ |
 |
|---|
| LysN LTQ |
 |
|---|
| TryLysC LTQ |
 |
|---|
| Try MSlow |
 |
|---|
| ChTry MSlow |
 |
|---|
| ArgC MSlow |
 |
|---|
| LysN MSlow |
 |
|---|
| TryLysC MSlow |
 |
|---|
| Try MShigh |
 |
|---|
| ChTry MShigh |
 |
|---|
| ArgC MShigh |
 |
|---|
| LysN MShigh |
 |
|---|
| TryLysC MShigh |
 |
|---|
General Statistics
Number of major isoforms |
Number of additional isoforms |
Number of all proteins |
Number of amino acids |
Min. Seq. Length |
Max. Seq. Length |
Avg. Seq. Length |
Avg. Mol. Weight |
|---|---|---|---|---|---|---|---|
0 |
1482787 |
23 |
8816 |
360.0 |
39.88 |
Amino acid frequency
Ala |
Cys |
Asp |
Glu |
Phe |
Gly |
His |
Ile |
Lys |
Leu |
|---|---|---|---|---|---|---|---|---|---|
9.09 ± 0.053 | 1.041 ± 0.015 |
5.849 ± 0.035 | 6.087 ± 0.034 |
3.906 ± 0.021 | 7.193 ± 0.044 |
2.304 ± 0.022 | 5.726 ± 0.029 |
4.349 ± 0.039 | 10.501 ± 0.055 |
Met |
Asn |
Gln |
Pro |
Arg |
Ser |
Thr |
Val |
Trp |
Tyr |
|---|---|---|---|---|---|---|---|---|---|
2.611 ± 0.025 | 3.9 ± 0.022 |
4.369 ± 0.026 | 4.649 ± 0.03 |
5.341 ± 0.039 | 6.541 ± 0.039 |
5.164 ± 0.055 | 7.091 ± 0.033 |
1.324 ± 0.015 | 2.965 ± 0.027 |
Most of the basic statistics you can see at this page can be downloaded from this CSV file
Proteome-pI is available under Creative Commons Attribution-NoDerivs license, for more details see here
| Reference: Kozlowski LP. Proteome-pI 2.0: Proteome Isoelectric Point Database Update. Nucleic Acids Res. 2021, doi: 10.1093/nar/gkab944 | Contact: Lukasz P. Kozlowski |
