Pseudomonas virus F116
Taxonomy: Viruses; Duplodnaviria; Heunggongvirae; Uroviricota; Caudoviricetes; Caudovirales; Podoviridae; Hollowayvirus
Average proteome isoelectric point is 6.6
Get precalculated fractions of proteins
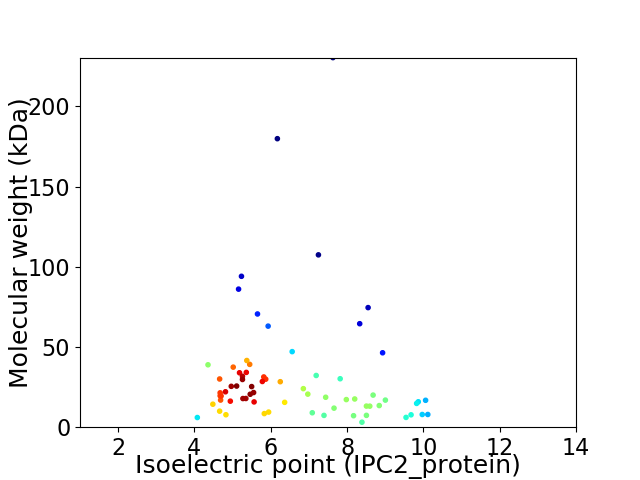
Virtual 2D-PAGE plot for 70 proteins (isoelectric point calculated using IPC2_protein)
Get csv file with sequences according to given criteria:
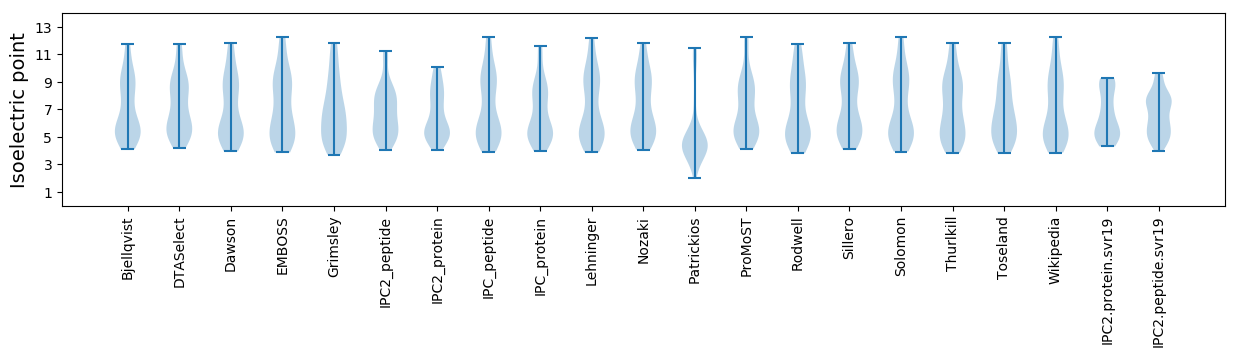
* You can choose from 21 different methods for calculating isoelectric point
Summary statistics related to proteome-wise predictions

Protein with the lowest isoelectric point:
>tr|Q5QF89|Q5QF89_9CAUD Uncharacterized protein OS=Pseudomonas virus F116 OX=280701 GN=21 PE=4 SV=1
MM1 pKa = 6.67MWTYY5 pKa = 11.07RR6 pKa = 11.84EE7 pKa = 3.91RR8 pKa = 11.84HH9 pKa = 5.13NRR11 pKa = 11.84AAFNCAQQAWDD22 pKa = 4.29RR23 pKa = 11.84EE24 pKa = 4.2VDD26 pKa = 4.05PLWDD30 pKa = 3.65QPDD33 pKa = 4.07PEE35 pKa = 6.11PEE37 pKa = 4.25DD38 pKa = 4.22EE39 pKa = 4.26EE40 pKa = 5.61QEE42 pKa = 5.18DD43 pKa = 3.93EE44 pKa = 6.16DD45 pKa = 4.33GLQRR49 pKa = 4.66
MM1 pKa = 6.67MWTYY5 pKa = 11.07RR6 pKa = 11.84EE7 pKa = 3.91RR8 pKa = 11.84HH9 pKa = 5.13NRR11 pKa = 11.84AAFNCAQQAWDD22 pKa = 4.29RR23 pKa = 11.84EE24 pKa = 4.2VDD26 pKa = 4.05PLWDD30 pKa = 3.65QPDD33 pKa = 4.07PEE35 pKa = 6.11PEE37 pKa = 4.25DD38 pKa = 4.22EE39 pKa = 4.26EE40 pKa = 5.61QEE42 pKa = 5.18DD43 pKa = 3.93EE44 pKa = 6.16DD45 pKa = 4.33GLQRR49 pKa = 4.66
Molecular weight: 6.03 kDa
Isoelectric point according different methods:
Protein with the highest isoelectric point:
>tr|Q5QF36|Q5QF36_9CAUD Uncharacterized protein OS=Pseudomonas virus F116 OX=280701 GN=4 PE=4 SV=1
MM1 pKa = 7.08KK2 pKa = 10.05QAPSTMQNEE11 pKa = 4.62TLGHH15 pKa = 6.32IRR17 pKa = 11.84AFWAEE22 pKa = 3.93KK23 pKa = 10.48GYY25 pKa = 11.18APTVAEE31 pKa = 4.49LAAKK35 pKa = 10.42AGVRR39 pKa = 11.84QFAIQQRR46 pKa = 11.84LTALEE51 pKa = 3.97NKK53 pKa = 10.21GYY55 pKa = 9.67IQRR58 pKa = 11.84DD59 pKa = 3.59PKK61 pKa = 9.84VARR64 pKa = 11.84SIRR67 pKa = 11.84PLL69 pKa = 3.42
MM1 pKa = 7.08KK2 pKa = 10.05QAPSTMQNEE11 pKa = 4.62TLGHH15 pKa = 6.32IRR17 pKa = 11.84AFWAEE22 pKa = 3.93KK23 pKa = 10.48GYY25 pKa = 11.18APTVAEE31 pKa = 4.49LAAKK35 pKa = 10.42AGVRR39 pKa = 11.84QFAIQQRR46 pKa = 11.84LTALEE51 pKa = 3.97NKK53 pKa = 10.21GYY55 pKa = 9.67IQRR58 pKa = 11.84DD59 pKa = 3.59PKK61 pKa = 9.84VARR64 pKa = 11.84SIRR67 pKa = 11.84PLL69 pKa = 3.42
Molecular weight: 7.72 kDa
Isoelectric point according different methods:
Peptides (in silico digests for buttom-up proteomics)
Below you can find in silico digests of the whole proteome with Trypsin, Chymotrypsin, Trypsin+LysC, LysN, ArgC proteases suitable for different mass spec machines.| Try ESI |
 |
|---|
| ChTry ESI |
|
|---|
| ArgC ESI |
|
|---|
| LysN ESI |
|
|---|
| TryLysC ESI |
|
|---|
| Try MALDI |
|
|---|
| ChTry MALDI |
|
|---|
| ArgC MALDI |
|
|---|
| LysN MALDI |
|
|---|
| TryLysC MALDI |
|
|---|
| Try LTQ |
|
|---|
| ChTry LTQ |
|
|---|
| ArgC LTQ |
|
|---|
| LysN LTQ |
|
|---|
| TryLysC LTQ |
|
|---|
| Try MSlow |
|
|---|
| ChTry MSlow |
|
|---|
| ArgC MSlow |
|
|---|
| LysN MSlow |
|
|---|
| TryLysC MSlow |
|
|---|
| Try MShigh |
|
|---|
| ChTry MShigh |
|
|---|
| ArgC MShigh |
|
|---|
| LysN MShigh |
|
|---|
| TryLysC MShigh |
|
|---|
General Statistics
Number of major isoforms |
Number of additional isoforms |
Number of all proteins |
Number of amino acids |
Min. Seq. Length |
Max. Seq. Length |
Avg. Seq. Length |
Avg. Mol. Weight |
|---|---|---|---|---|---|---|---|
0 |
20200 |
30 |
2129 |
288.6 |
31.67 |
Amino acid frequency
Ala |
Cys |
Asp |
Glu |
Phe |
Gly |
His |
Ile |
Lys |
Leu |
|---|---|---|---|---|---|---|---|---|---|
12.302 ± 0.532 | 1.059 ± 0.199 |
6.183 ± 0.184 | 6.109 ± 0.291 |
3.02 ± 0.185 | 8.134 ± 0.291 |
2.089 ± 0.164 | 4.129 ± 0.218 |
3.817 ± 0.273 | 7.891 ± 0.27 |
Met |
Asn |
Gln |
Pro |
Arg |
Ser |
Thr |
Val |
Trp |
Tyr |
|---|---|---|---|---|---|---|---|---|---|
2.337 ± 0.164 | 2.896 ± 0.148 |
5.861 ± 0.366 | 5.139 ± 0.263 |
7.861 ± 0.36 | 5.322 ± 0.191 |
5.421 ± 0.21 | 6.292 ± 0.244 |
1.614 ± 0.165 | 2.525 ± 0.214 |
Most of the basic statistics you can see at this page can be downloaded from this CSV file
See this proteome in:

Proteome-pI is available under Creative Commons Attribution-NoDerivs license, for more details see here
| Reference: Kozlowski LP. Proteome-pI 2.0: Proteome Isoelectric Point Database Update. Nucleic Acids Res. 2021, doi: 10.1093/nar/gkab944 | Contact: Lukasz P. Kozlowski |