Arabis alpina (Alpine rock-cress)
Taxonomy: cellular organisms; Eukaryota; Viridiplantae; Streptophyta; Streptophytina; Embryophyta; Tracheophyta; Euphyllophyta; Spermatophyta; Magnoliopsida; Mesangiospermae; eudicotyledons; Gunneridae; Pentapetalae; rosids; malvids; Brassicales; Brassicaceae; Arabideae; Arabis
Average proteome isoelectric point is 6.66
Get precalculated fractions of proteins

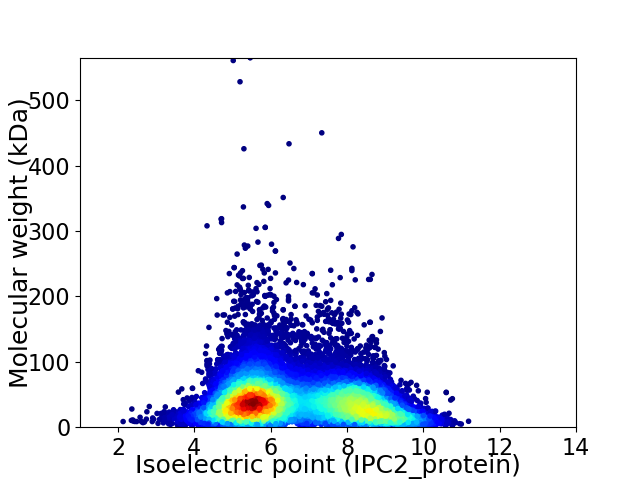
Virtual 2D-PAGE plot for 23245 proteins (isoelectric point calculated using IPC2_protein)
Get csv file with sequences according to given criteria:
* You can choose from 21 different methods for calculating isoelectric point
Summary statistics related to proteome-wise predictions


Protein with the lowest isoelectric point:
>tr|A0A087HHS5|A0A087HHS5_ARAAL Lipoxygenase OS=Arabis alpina OX=50452 GN=AALP_AA2G158600 PE=3 SV=1
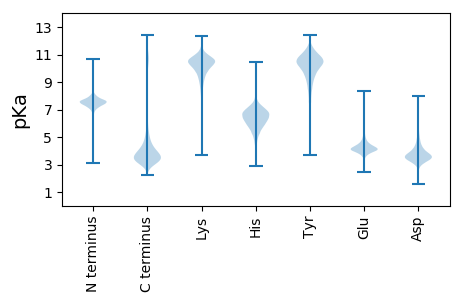
MM1 pKa = 6.49NTVVFLMVYY10 pKa = 9.21QKK12 pKa = 11.16NVFNDD17 pKa = 3.35VYY19 pKa = 11.05GGVPEE24 pKa = 5.42DD25 pKa = 3.83VLEE28 pKa = 4.72DD29 pKa = 4.12GYY31 pKa = 11.82GGVFDD36 pKa = 4.88GVLEE40 pKa = 4.2GVYY43 pKa = 10.66GSVPNGVNGVPDD55 pKa = 4.06GVLVGVPVSVPGGGDD70 pKa = 3.03GGIPGNVHH78 pKa = 6.92DD79 pKa = 5.0SVPKK83 pKa = 9.4VVYY86 pKa = 10.22GGVPTAVLEE95 pKa = 4.23NVDD98 pKa = 3.41GGVPVGLPEE107 pKa = 4.44GRR109 pKa = 11.84DD110 pKa = 3.27GGIPDD115 pKa = 3.94NVHH118 pKa = 6.93DD119 pKa = 4.71GVPKK123 pKa = 10.71VVDD126 pKa = 3.97DD127 pKa = 4.39GVPAGVDD134 pKa = 3.14GGVPAGVDD142 pKa = 3.17GGVPADD148 pKa = 3.55VSEE151 pKa = 4.3VLDD154 pKa = 3.98GGVPDD159 pKa = 5.89GIPEE163 pKa = 4.29GVDD166 pKa = 2.79NGVQGEE172 pKa = 4.3DD173 pKa = 3.14GGIPGTVWKK182 pKa = 10.32VKK184 pKa = 8.42TVVYY188 pKa = 8.13QTVCQIVYY196 pKa = 10.27RR197 pKa = 11.84IMYY200 pKa = 7.24TAVYY204 pKa = 8.71WKK206 pKa = 10.66LL207 pKa = 3.25
MM1 pKa = 6.49NTVVFLMVYY10 pKa = 9.21QKK12 pKa = 11.16NVFNDD17 pKa = 3.35VYY19 pKa = 11.05GGVPEE24 pKa = 5.42DD25 pKa = 3.83VLEE28 pKa = 4.72DD29 pKa = 4.12GYY31 pKa = 11.82GGVFDD36 pKa = 4.88GVLEE40 pKa = 4.2GVYY43 pKa = 10.66GSVPNGVNGVPDD55 pKa = 4.06GVLVGVPVSVPGGGDD70 pKa = 3.03GGIPGNVHH78 pKa = 6.92DD79 pKa = 5.0SVPKK83 pKa = 9.4VVYY86 pKa = 10.22GGVPTAVLEE95 pKa = 4.23NVDD98 pKa = 3.41GGVPVGLPEE107 pKa = 4.44GRR109 pKa = 11.84DD110 pKa = 3.27GGIPDD115 pKa = 3.94NVHH118 pKa = 6.93DD119 pKa = 4.71GVPKK123 pKa = 10.71VVDD126 pKa = 3.97DD127 pKa = 4.39GVPAGVDD134 pKa = 3.14GGVPAGVDD142 pKa = 3.17GGVPADD148 pKa = 3.55VSEE151 pKa = 4.3VLDD154 pKa = 3.98GGVPDD159 pKa = 5.89GIPEE163 pKa = 4.29GVDD166 pKa = 2.79NGVQGEE172 pKa = 4.3DD173 pKa = 3.14GGIPGTVWKK182 pKa = 10.32VKK184 pKa = 8.42TVVYY188 pKa = 8.13QTVCQIVYY196 pKa = 10.27RR197 pKa = 11.84IMYY200 pKa = 7.24TAVYY204 pKa = 8.71WKK206 pKa = 10.66LL207 pKa = 3.25
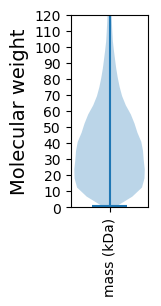
Molecular weight: 20.88 kDa
Isoelectric point according different methods:
Protein with the highest isoelectric point:
>tr|A0A087FY95|A0A087FY95_ARAAL Uncharacterized protein OS=Arabis alpina OX=50452 GN=AALP_AAs54367U000100 PE=3 SV=1
DDD2 pKa = 4.01AGGVLVRR9 pKa = 11.84AVPAQRR15 pKa = 11.84RR16 pKa = 11.84AVVPAAGARR25 pKa = 11.84AALLAAGAPGPQRR38 pKa = 11.84QGLRR42 pKa = 11.84LQPARR47 pKa = 11.84RR48 pKa = 11.84HHH50 pKa = 4.62RR51 pKa = 11.84RR52 pKa = 11.84RR53 pKa = 11.84PRR55 pKa = 11.84AQRR58 pKa = 11.84HHH60 pKa = 5.03PPVQGARR67 pKa = 11.84RR68 pKa = 11.84RR69 pKa = 11.84PGRR72 pKa = 11.84VRR74 pKa = 11.84VPQGHHH80 pKa = 6.1PVSV
DDD2 pKa = 4.01AGGVLVRR9 pKa = 11.84AVPAQRR15 pKa = 11.84RR16 pKa = 11.84AVVPAAGARR25 pKa = 11.84AALLAAGAPGPQRR38 pKa = 11.84QGLRR42 pKa = 11.84LQPARR47 pKa = 11.84RR48 pKa = 11.84HHH50 pKa = 4.62RR51 pKa = 11.84RR52 pKa = 11.84RR53 pKa = 11.84PRR55 pKa = 11.84AQRR58 pKa = 11.84HHH60 pKa = 5.03PPVQGARR67 pKa = 11.84RR68 pKa = 11.84RR69 pKa = 11.84PGRR72 pKa = 11.84VRR74 pKa = 11.84VPQGHHH80 pKa = 6.1PVSV
Molecular weight: 9.05 kDa
Isoelectric point according different methods:
Peptides (in silico digests for buttom-up proteomics)
Below you can find in silico digests of the whole proteome with Trypsin, Chymotrypsin, Trypsin+LysC, LysN, ArgC proteases suitable for different mass spec machines.| Try ESI |
 |
|---|
| ChTry ESI |
 |
|---|
| ArgC ESI |
 |
|---|
| LysN ESI |
 |
|---|
| TryLysC ESI |
 |
|---|
| Try MALDI |
 |
|---|
| ChTry MALDI |
 |
|---|
| ArgC MALDI |
 |
|---|
| LysN MALDI |
 |
|---|
| TryLysC MALDI |
 |
|---|
| Try LTQ |
 |
|---|
| ChTry LTQ |
 |
|---|
| ArgC LTQ |
 |
|---|
| LysN LTQ |
 |
|---|
| TryLysC LTQ |
 |
|---|
| Try MSlow |
 |
|---|
| ChTry MSlow |
 |
|---|
| ArgC MSlow |
 |
|---|
| LysN MSlow |
 |
|---|
| TryLysC MSlow |
 |
|---|
| Try MShigh |
 |
|---|
| ChTry MShigh |
 |
|---|
| ArgC MShigh |
 |
|---|
| LysN MShigh |
 |
|---|
| TryLysC MShigh |
 |
|---|
General Statistics
Number of major isoforms |
Number of additional isoforms |
Number of all proteins |
Number of amino acids |
Min. Seq. Length |
Max. Seq. Length |
Avg. Seq. Length |
Avg. Mol. Weight |
|---|---|---|---|---|---|---|---|
9104347 |
8 |
5083 |
391.7 |
43.7 |
Amino acid frequency
Ala |
Cys |
Asp |
Glu |
Phe |
Gly |
His |
Ile |
Lys |
Leu |
|---|---|---|---|---|---|---|---|---|---|
6.572 ± 0.016 | 1.731 ± 0.008 |
5.544 ± 0.011 | 6.923 ± 0.02 |
4.157 ± 0.011 | 6.497 ± 0.016 |
2.195 ± 0.007 | 5.184 ± 0.012 |
6.343 ± 0.018 | 9.434 ± 0.019 |
Met |
Asn |
Gln |
Pro |
Arg |
Ser |
Thr |
Val |
Trp |
Tyr |
|---|---|---|---|---|---|---|---|---|---|
2.407 ± 0.007 | 4.246 ± 0.011 |
4.919 ± 0.014 | 3.405 ± 0.011 |
5.513 ± 0.013 | 8.991 ± 0.021 |
5.181 ± 0.011 | 6.79 ± 0.014 |
1.217 ± 0.005 | 2.706 ± 0.008 |
Most of the basic statistics you can see at this page can be downloaded from this CSV file
Proteome-pI is available under Creative Commons Attribution-NoDerivs license, for more details see here
| Reference: Kozlowski LP. Proteome-pI 2.0: Proteome Isoelectric Point Database Update. Nucleic Acids Res. 2021, doi: 10.1093/nar/gkab944 | Contact: Lukasz P. Kozlowski |
