Staphylococcus phage StB20-like
Taxonomy: Viruses; Duplodnaviria; Heunggongvirae; Uroviricota; Caudoviricetes; Caudovirales; Siphoviridae; unclassified Siphoviridae
Average proteome isoelectric point is 6.61
Get precalculated fractions of proteins

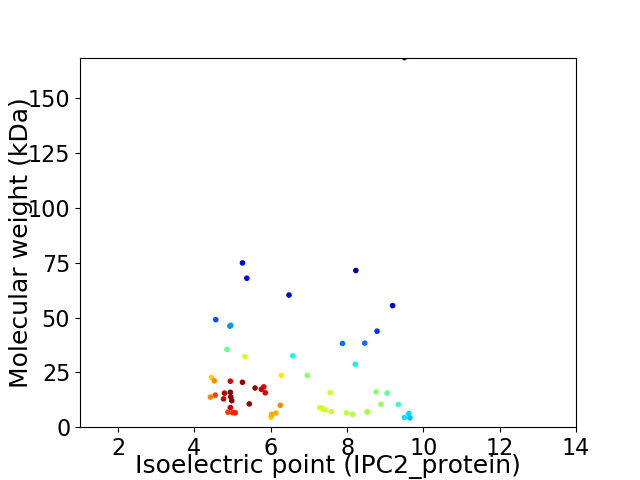
Virtual 2D-PAGE plot for 59 proteins (isoelectric point calculated using IPC2_protein)
Get csv file with sequences according to given criteria:
* You can choose from 21 different methods for calculating isoelectric point
Summary statistics related to proteome-wise predictions


Protein with the lowest isoelectric point:
>tr|A0A0N9SH85|A0A0N9SH85_9CAUD Endodeoxyribonuclease RusA OS=Staphylococcus phage StB20-like OX=1732064 GN=StB20like_00033 PE=4 SV=1
MM1 pKa = 7.73SMTNSNVDD9 pKa = 2.78TGQQDD14 pKa = 3.78MVVEE18 pKa = 5.08GYY20 pKa = 10.99AIIFNSMSDD29 pKa = 3.4DD30 pKa = 3.43LGGFRR35 pKa = 11.84EE36 pKa = 4.34IVAPNALDD44 pKa = 3.93GVDD47 pKa = 3.88VSDD50 pKa = 3.95VKK52 pKa = 11.21CLINHH57 pKa = 6.81DD58 pKa = 4.04FSYY61 pKa = 11.33VIGRR65 pKa = 11.84TQAGTLEE72 pKa = 4.17LQVDD76 pKa = 3.92EE77 pKa = 4.85KK78 pKa = 11.46GLYY81 pKa = 8.73FKK83 pKa = 10.94CHH85 pKa = 6.57LPNTSYY91 pKa = 11.46ARR93 pKa = 11.84DD94 pKa = 3.19IYY96 pKa = 11.41EE97 pKa = 4.31NIKK100 pKa = 10.32AGNVNQCSFFYY111 pKa = 10.23TLPPNDD117 pKa = 3.19STARR121 pKa = 11.84TWQNIDD127 pKa = 3.08NEE129 pKa = 4.46YY130 pKa = 10.44VQTINKK136 pKa = 8.74IDD138 pKa = 3.73EE139 pKa = 5.03LIEE142 pKa = 3.92VSIVTIPAYY151 pKa = 9.86KK152 pKa = 9.26DD153 pKa = 3.02TSVEE157 pKa = 3.88VGQRR161 pKa = 11.84ARR163 pKa = 11.84DD164 pKa = 3.56LKK166 pKa = 10.89KK167 pKa = 10.66FKK169 pKa = 10.37QLEE172 pKa = 4.12QMKK175 pKa = 10.15IALDD179 pKa = 3.8LEE181 pKa = 4.47SLRR184 pKa = 11.84FEE186 pKa = 4.44TT187 pKa = 5.56
MM1 pKa = 7.73SMTNSNVDD9 pKa = 2.78TGQQDD14 pKa = 3.78MVVEE18 pKa = 5.08GYY20 pKa = 10.99AIIFNSMSDD29 pKa = 3.4DD30 pKa = 3.43LGGFRR35 pKa = 11.84EE36 pKa = 4.34IVAPNALDD44 pKa = 3.93GVDD47 pKa = 3.88VSDD50 pKa = 3.95VKK52 pKa = 11.21CLINHH57 pKa = 6.81DD58 pKa = 4.04FSYY61 pKa = 11.33VIGRR65 pKa = 11.84TQAGTLEE72 pKa = 4.17LQVDD76 pKa = 3.92EE77 pKa = 4.85KK78 pKa = 11.46GLYY81 pKa = 8.73FKK83 pKa = 10.94CHH85 pKa = 6.57LPNTSYY91 pKa = 11.46ARR93 pKa = 11.84DD94 pKa = 3.19IYY96 pKa = 11.41EE97 pKa = 4.31NIKK100 pKa = 10.32AGNVNQCSFFYY111 pKa = 10.23TLPPNDD117 pKa = 3.19STARR121 pKa = 11.84TWQNIDD127 pKa = 3.08NEE129 pKa = 4.46YY130 pKa = 10.44VQTINKK136 pKa = 8.74IDD138 pKa = 3.73EE139 pKa = 5.03LIEE142 pKa = 3.92VSIVTIPAYY151 pKa = 9.86KK152 pKa = 9.26DD153 pKa = 3.02TSVEE157 pKa = 3.88VGQRR161 pKa = 11.84ARR163 pKa = 11.84DD164 pKa = 3.56LKK166 pKa = 10.89KK167 pKa = 10.66FKK169 pKa = 10.37QLEE172 pKa = 4.12QMKK175 pKa = 10.15IALDD179 pKa = 3.8LEE181 pKa = 4.47SLRR184 pKa = 11.84FEE186 pKa = 4.44TT187 pKa = 5.56
Molecular weight: 21.14 kDa
Isoelectric point according different methods:
Protein with the highest isoelectric point:
>tr|A0A0N9SKK8|A0A0N9SKK8_9CAUD Transcriptional activator RinB OS=Staphylococcus phage StB20-like OX=1732064 GN=StB20like_00029 PE=4 SV=1
MM1 pKa = 7.45LPFSVFLLKK10 pKa = 10.28KK11 pKa = 9.75VKK13 pKa = 10.2NNKK16 pKa = 8.41GRR18 pKa = 11.84HH19 pKa = 4.26ATRR22 pKa = 11.84KK23 pKa = 9.45IILEE27 pKa = 4.34IILDD31 pKa = 3.43VTYY34 pKa = 11.22NVFKK38 pKa = 10.09ITRR41 pKa = 11.84EE42 pKa = 3.85GLALGPRR49 pKa = 11.84MGVGEE54 pKa = 4.3SS55 pKa = 3.24
MM1 pKa = 7.45LPFSVFLLKK10 pKa = 10.28KK11 pKa = 9.75VKK13 pKa = 10.2NNKK16 pKa = 8.41GRR18 pKa = 11.84HH19 pKa = 4.26ATRR22 pKa = 11.84KK23 pKa = 9.45IILEE27 pKa = 4.34IILDD31 pKa = 3.43VTYY34 pKa = 11.22NVFKK38 pKa = 10.09ITRR41 pKa = 11.84EE42 pKa = 3.85GLALGPRR49 pKa = 11.84MGVGEE54 pKa = 4.3SS55 pKa = 3.24
Molecular weight: 6.21 kDa
Isoelectric point according different methods:
Peptides (in silico digests for buttom-up proteomics)
Below you can find in silico digests of the whole proteome with Trypsin, Chymotrypsin, Trypsin+LysC, LysN, ArgC proteases suitable for different mass spec machines.| Try ESI |
 |
|---|
| ChTry ESI |
 |
|---|
| ArgC ESI |
 |
|---|
| LysN ESI |
 |
|---|
| TryLysC ESI |
 |
|---|
| Try MALDI |
 |
|---|
| ChTry MALDI |
 |
|---|
| ArgC MALDI |
 |
|---|
| LysN MALDI |
 |
|---|
| TryLysC MALDI |
 |
|---|
| Try LTQ |
 |
|---|
| ChTry LTQ |
 |
|---|
| ArgC LTQ |
 |
|---|
| LysN LTQ |
 |
|---|
| TryLysC LTQ |
 |
|---|
| Try MSlow |
 |
|---|
| ChTry MSlow |
 |
|---|
| ArgC MSlow |
 |
|---|
| LysN MSlow |
 |
|---|
| TryLysC MSlow |
 |
|---|
| Try MShigh |
 |
|---|
| ChTry MShigh |
 |
|---|
| ArgC MShigh |
 |
|---|
| LysN MShigh |
 |
|---|
| TryLysC MShigh |
 |
|---|
General Statistics
Number of major isoforms |
Number of additional isoforms |
Number of all proteins |
Number of amino acids |
Min. Seq. Length |
Max. Seq. Length |
Avg. Seq. Length |
Avg. Mol. Weight |
|---|---|---|---|---|---|---|---|
0 |
12327 |
37 |
1570 |
208.9 |
23.83 |
Amino acid frequency
Ala |
Cys |
Asp |
Glu |
Phe |
Gly |
His |
Ile |
Lys |
Leu |
|---|---|---|---|---|---|---|---|---|---|
5.857 ± 0.551 | 0.535 ± 0.096 |
5.979 ± 0.353 | 7.374 ± 0.711 |
4.121 ± 0.229 | 5.808 ± 0.667 |
1.882 ± 0.155 | 7.828 ± 0.312 |
9.581 ± 0.364 | 7.812 ± 0.321 |
Met |
Asn |
Gln |
Pro |
Arg |
Ser |
Thr |
Val |
Trp |
Tyr |
|---|---|---|---|---|---|---|---|---|---|
2.555 ± 0.241 | 7.269 ± 0.304 |
2.985 ± 0.17 | 3.991 ± 0.309 |
3.724 ± 0.172 | 5.963 ± 0.311 |
5.695 ± 0.257 | 5.881 ± 0.208 |
1.079 ± 0.149 | 4.08 ± 0.309 |
Most of the basic statistics you can see at this page can be downloaded from this CSV file
Proteome-pI is available under Creative Commons Attribution-NoDerivs license, for more details see here
| Reference: Kozlowski LP. Proteome-pI 2.0: Proteome Isoelectric Point Database Update. Nucleic Acids Res. 2021, doi: 10.1093/nar/gkab944 | Contact: Lukasz P. Kozlowski |
