Altererythrobacter sp. Root672
Taxonomy: cellular organisms; Bacteria; Proteobacteria; Alphaproteobacteria; Sphingomonadales; Erythrobacteraceae; Altererythrobacter; unclassified Altererythrobacter
Average proteome isoelectric point is 6.12
Get precalculated fractions of proteins

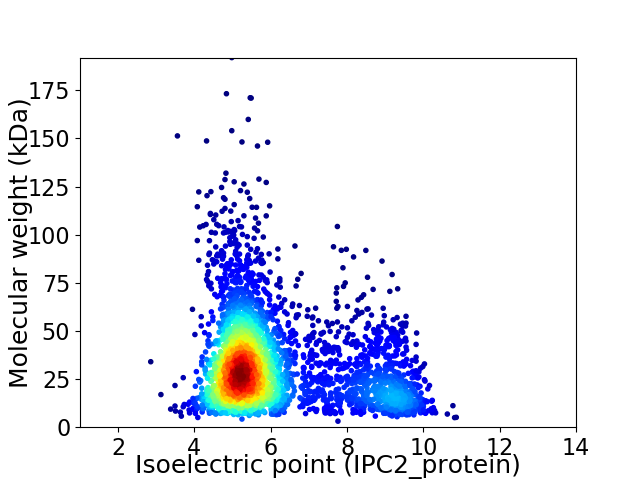
Virtual 2D-PAGE plot for 3454 proteins (isoelectric point calculated using IPC2_protein)
Get csv file with sequences according to given criteria:
* You can choose from 21 different methods for calculating isoelectric point
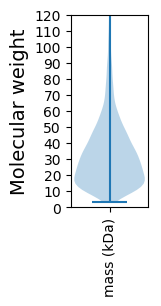
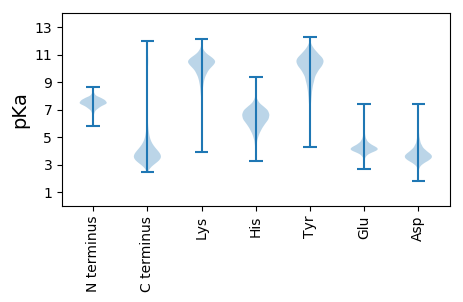
Summary statistics related to proteome-wise predictions


Protein with the lowest isoelectric point:
>tr|A0A0T2QI24|A0A0T2QI24_9SPHN Pilus assembly protein TadC OS=Altererythrobacter sp. Root672 OX=1736584 GN=ASD76_10195 PE=4 SV=1
MM1 pKa = 6.77LTSVRR6 pKa = 11.84SLTAATLLVGTALAATPAFAQDD28 pKa = 3.34APAEE32 pKa = 4.2KK33 pKa = 9.64TPLVTVTGSTTLVTDD48 pKa = 3.14YY49 pKa = 10.91RR50 pKa = 11.84FRR52 pKa = 11.84GVGLSGGDD60 pKa = 3.29IAIQGGLTLNTTPGFYY76 pKa = 10.49VGTWASSLEE85 pKa = 3.98DD86 pKa = 3.36SPVYY90 pKa = 10.92GEE92 pKa = 4.5VEE94 pKa = 3.88LDD96 pKa = 3.98VFGGWTGEE104 pKa = 4.28VTDD107 pKa = 5.24GLAADD112 pKa = 3.92VGVTYY117 pKa = 10.27YY118 pKa = 11.01AYY120 pKa = 9.61PSKK123 pKa = 10.77DD124 pKa = 3.1AGAGPSDD131 pKa = 2.92VWEE134 pKa = 5.02FYY136 pKa = 11.32GKK138 pKa = 10.49LKK140 pKa = 9.16PTLGPVGLTFGLYY153 pKa = 10.06YY154 pKa = 10.91SPDD157 pKa = 3.41QDD159 pKa = 4.31SLGGGDD165 pKa = 4.38NLYY168 pKa = 10.88LSADD172 pKa = 3.47AGVGIPEE179 pKa = 4.26TPISFSAHH187 pKa = 4.54VGYY190 pKa = 9.3TDD192 pKa = 4.61GFLTLTDD199 pKa = 4.36NGKK202 pKa = 9.7AWDD205 pKa = 3.73WSVGASATVLGGLSLGLSYY224 pKa = 11.32VGVEE228 pKa = 4.42GSQINGSIDD237 pKa = 3.27GVTDD241 pKa = 3.49DD242 pKa = 4.52TVVASLGYY250 pKa = 10.91AFF252 pKa = 5.53
MM1 pKa = 6.77LTSVRR6 pKa = 11.84SLTAATLLVGTALAATPAFAQDD28 pKa = 3.34APAEE32 pKa = 4.2KK33 pKa = 9.64TPLVTVTGSTTLVTDD48 pKa = 3.14YY49 pKa = 10.91RR50 pKa = 11.84FRR52 pKa = 11.84GVGLSGGDD60 pKa = 3.29IAIQGGLTLNTTPGFYY76 pKa = 10.49VGTWASSLEE85 pKa = 3.98DD86 pKa = 3.36SPVYY90 pKa = 10.92GEE92 pKa = 4.5VEE94 pKa = 3.88LDD96 pKa = 3.98VFGGWTGEE104 pKa = 4.28VTDD107 pKa = 5.24GLAADD112 pKa = 3.92VGVTYY117 pKa = 10.27YY118 pKa = 11.01AYY120 pKa = 9.61PSKK123 pKa = 10.77DD124 pKa = 3.1AGAGPSDD131 pKa = 2.92VWEE134 pKa = 5.02FYY136 pKa = 11.32GKK138 pKa = 10.49LKK140 pKa = 9.16PTLGPVGLTFGLYY153 pKa = 10.06YY154 pKa = 10.91SPDD157 pKa = 3.41QDD159 pKa = 4.31SLGGGDD165 pKa = 4.38NLYY168 pKa = 10.88LSADD172 pKa = 3.47AGVGIPEE179 pKa = 4.26TPISFSAHH187 pKa = 4.54VGYY190 pKa = 9.3TDD192 pKa = 4.61GFLTLTDD199 pKa = 4.36NGKK202 pKa = 9.7AWDD205 pKa = 3.73WSVGASATVLGGLSLGLSYY224 pKa = 11.32VGVEE228 pKa = 4.42GSQINGSIDD237 pKa = 3.27GVTDD241 pKa = 3.49DD242 pKa = 4.52TVVASLGYY250 pKa = 10.91AFF252 pKa = 5.53
Molecular weight: 25.73 kDa
Isoelectric point according different methods:
Protein with the highest isoelectric point:
>tr|A0A0T2QAJ2|A0A0T2QAJ2_9SPHN Thioesterase OS=Altererythrobacter sp. Root672 OX=1736584 GN=ASD76_12050 PE=4 SV=1
MM1 pKa = 7.45KK2 pKa = 9.61RR3 pKa = 11.84TFQPSNLVRR12 pKa = 11.84ARR14 pKa = 11.84RR15 pKa = 11.84HH16 pKa = 4.89GFFARR21 pKa = 11.84KK22 pKa = 8.02ATVGGRR28 pKa = 11.84KK29 pKa = 9.11VLANRR34 pKa = 11.84RR35 pKa = 11.84KK36 pKa = 9.54RR37 pKa = 11.84GRR39 pKa = 11.84KK40 pKa = 8.81KK41 pKa = 10.45LCAA44 pKa = 3.96
MM1 pKa = 7.45KK2 pKa = 9.61RR3 pKa = 11.84TFQPSNLVRR12 pKa = 11.84ARR14 pKa = 11.84RR15 pKa = 11.84HH16 pKa = 4.89GFFARR21 pKa = 11.84KK22 pKa = 8.02ATVGGRR28 pKa = 11.84KK29 pKa = 9.11VLANRR34 pKa = 11.84RR35 pKa = 11.84KK36 pKa = 9.54RR37 pKa = 11.84GRR39 pKa = 11.84KK40 pKa = 8.81KK41 pKa = 10.45LCAA44 pKa = 3.96
Molecular weight: 5.13 kDa
Isoelectric point according different methods:
Peptides (in silico digests for buttom-up proteomics)
Below you can find in silico digests of the whole proteome with Trypsin, Chymotrypsin, Trypsin+LysC, LysN, ArgC proteases suitable for different mass spec machines.| Try ESI |
 |
|---|
| ChTry ESI |
 |
|---|
| ArgC ESI |
 |
|---|
| LysN ESI |
 |
|---|
| TryLysC ESI |
 |
|---|
| Try MALDI |
 |
|---|
| ChTry MALDI |
 |
|---|
| ArgC MALDI |
 |
|---|
| LysN MALDI |
 |
|---|
| TryLysC MALDI |
 |
|---|
| Try LTQ |
 |
|---|
| ChTry LTQ |
 |
|---|
| ArgC LTQ |
 |
|---|
| LysN LTQ |
 |
|---|
| TryLysC LTQ |
 |
|---|
| Try MSlow |
 |
|---|
| ChTry MSlow |
 |
|---|
| ArgC MSlow |
 |
|---|
| LysN MSlow |
 |
|---|
| TryLysC MSlow |
 |
|---|
| Try MShigh |
 |
|---|
| ChTry MShigh |
 |
|---|
| ArgC MShigh |
 |
|---|
| LysN MShigh |
 |
|---|
| TryLysC MShigh |
 |
|---|
General Statistics
Number of major isoforms |
Number of additional isoforms |
Number of all proteins |
Number of amino acids |
Min. Seq. Length |
Max. Seq. Length |
Avg. Seq. Length |
Avg. Mol. Weight |
|---|---|---|---|---|---|---|---|
0 |
1085735 |
29 |
1783 |
314.3 |
34.08 |
Amino acid frequency
Ala |
Cys |
Asp |
Glu |
Phe |
Gly |
His |
Ile |
Lys |
Leu |
|---|---|---|---|---|---|---|---|---|---|
12.373 ± 0.055 | 0.787 ± 0.013 |
5.793 ± 0.031 | 6.106 ± 0.043 |
3.719 ± 0.027 | 8.924 ± 0.045 |
1.909 ± 0.021 | 4.84 ± 0.026 |
3.035 ± 0.032 | 10.018 ± 0.048 |
Met |
Asn |
Gln |
Pro |
Arg |
Ser |
Thr |
Val |
Trp |
Tyr |
|---|---|---|---|---|---|---|---|---|---|
2.314 ± 0.017 | 2.718 ± 0.024 |
5.363 ± 0.03 | 3.302 ± 0.022 |
6.976 ± 0.038 | 5.436 ± 0.032 |
5.299 ± 0.032 | 7.32 ± 0.031 |
1.505 ± 0.019 | 2.265 ± 0.022 |
Most of the basic statistics you can see at this page can be downloaded from this CSV file
Proteome-pI is available under Creative Commons Attribution-NoDerivs license, for more details see here
| Reference: Kozlowski LP. Proteome-pI 2.0: Proteome Isoelectric Point Database Update. Nucleic Acids Res. 2021, doi: 10.1093/nar/gkab944 | Contact: Lukasz P. Kozlowski |
