Mycoplasma flocculare ATCC 27399
Taxonomy: cellular organisms; Bacteria; Terrabacteria group; Tenericutes; Mollicutes; Mycoplasmatales; Mycoplasmataceae; Mycoplasma; Mycoplasma flocculare
Average proteome isoelectric point is 8.13
Get precalculated fractions of proteins

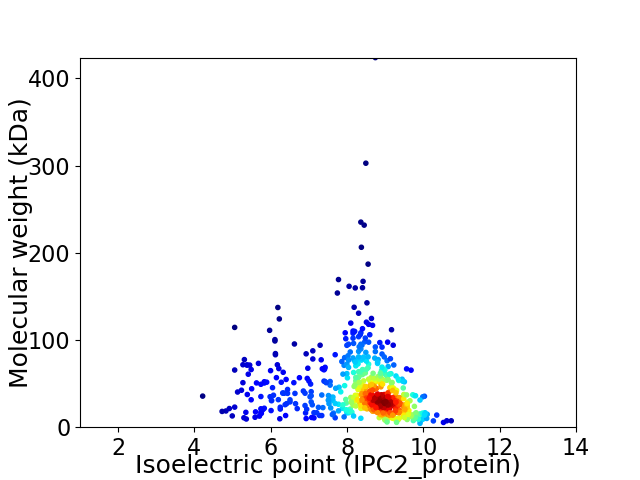
Virtual 2D-PAGE plot for 553 proteins (isoelectric point calculated using IPC2_protein)
Get csv file with sequences according to given criteria:
* You can choose from 21 different methods for calculating isoelectric point
Summary statistics related to proteome-wise predictions


Protein with the lowest isoelectric point:
>tr|A0A0A8E6Z4|A0A0A8E6Z4_MYCFL Oligopeptide ABC transporter permease protein OS=Mycoplasma flocculare ATCC 27399 OX=743971 GN=oppC PE=3 SV=1
MM1 pKa = 8.08PYY3 pKa = 10.45LDD5 pKa = 4.09KK6 pKa = 10.88QRR8 pKa = 11.84KK9 pKa = 9.25DD10 pKa = 3.31GLLQSDD16 pKa = 3.97AFYY19 pKa = 11.55NEE21 pKa = 4.13LFLGLFGFGFWYY33 pKa = 10.23LGRR36 pKa = 11.84VSLAIIRR43 pKa = 11.84FTFTIVGLLMIFIPQMMYY61 pKa = 10.63LGSTAQDD68 pKa = 3.53EE69 pKa = 4.79IKK71 pKa = 10.84NDD73 pKa = 3.49VYY75 pKa = 11.08ILTIVGGVILAVSLLWNIITTIMIFTADD103 pKa = 3.43MRR105 pKa = 11.84DD106 pKa = 3.57DD107 pKa = 3.76RR108 pKa = 11.84GGKK111 pKa = 8.2ILHH114 pKa = 6.86WGTEE118 pKa = 3.97IEE120 pKa = 4.76DD121 pKa = 3.86NPDD124 pKa = 3.23LEE126 pKa = 4.73DD127 pKa = 4.2AFDD130 pKa = 3.83IPVEE134 pKa = 4.31EE135 pKa = 4.67EE136 pKa = 3.65EE137 pKa = 4.49STPVLAMEE145 pKa = 4.31TEE147 pKa = 4.47SVIEE151 pKa = 3.95EE152 pKa = 4.38TEE154 pKa = 4.0ALDD157 pKa = 3.82LQVEE161 pKa = 4.44SLEE164 pKa = 4.43PEE166 pKa = 4.13SLEE169 pKa = 3.98PEE171 pKa = 4.45PVTEE175 pKa = 3.93PVYY178 pKa = 10.59FEE180 pKa = 3.68PVKK183 pKa = 10.49PVFEE187 pKa = 4.7PEE189 pKa = 4.1FVTDD193 pKa = 3.79PVVAEE198 pKa = 4.49PVFGTQPVKK207 pKa = 10.41PVAEE211 pKa = 4.32PPVAEE216 pKa = 4.11PVVKK220 pKa = 10.11PVFEE224 pKa = 4.35PVAEE228 pKa = 4.05PVKK231 pKa = 10.31PVAEE235 pKa = 4.01PVVKK239 pKa = 10.01PVFEE243 pKa = 4.25VEE245 pKa = 4.2EE246 pKa = 4.35NFDD249 pKa = 3.26IARR252 pKa = 11.84QIEE255 pKa = 4.72MINTEE260 pKa = 4.05QVQISQLQTVQKK272 pKa = 11.15AEE274 pKa = 3.95IPVDD278 pKa = 4.43FSALKK283 pKa = 9.98HH284 pKa = 5.22IHH286 pKa = 6.03HH287 pKa = 6.52TTFTIQEE294 pKa = 4.1IEE296 pKa = 4.06SGIVDD301 pKa = 3.32EE302 pKa = 4.84HH303 pKa = 7.86FEE305 pKa = 4.43IRR307 pKa = 11.84GQHH310 pKa = 7.09DD311 pKa = 3.81ISCHH315 pKa = 4.88KK316 pKa = 10.67
MM1 pKa = 8.08PYY3 pKa = 10.45LDD5 pKa = 4.09KK6 pKa = 10.88QRR8 pKa = 11.84KK9 pKa = 9.25DD10 pKa = 3.31GLLQSDD16 pKa = 3.97AFYY19 pKa = 11.55NEE21 pKa = 4.13LFLGLFGFGFWYY33 pKa = 10.23LGRR36 pKa = 11.84VSLAIIRR43 pKa = 11.84FTFTIVGLLMIFIPQMMYY61 pKa = 10.63LGSTAQDD68 pKa = 3.53EE69 pKa = 4.79IKK71 pKa = 10.84NDD73 pKa = 3.49VYY75 pKa = 11.08ILTIVGGVILAVSLLWNIITTIMIFTADD103 pKa = 3.43MRR105 pKa = 11.84DD106 pKa = 3.57DD107 pKa = 3.76RR108 pKa = 11.84GGKK111 pKa = 8.2ILHH114 pKa = 6.86WGTEE118 pKa = 3.97IEE120 pKa = 4.76DD121 pKa = 3.86NPDD124 pKa = 3.23LEE126 pKa = 4.73DD127 pKa = 4.2AFDD130 pKa = 3.83IPVEE134 pKa = 4.31EE135 pKa = 4.67EE136 pKa = 3.65EE137 pKa = 4.49STPVLAMEE145 pKa = 4.31TEE147 pKa = 4.47SVIEE151 pKa = 3.95EE152 pKa = 4.38TEE154 pKa = 4.0ALDD157 pKa = 3.82LQVEE161 pKa = 4.44SLEE164 pKa = 4.43PEE166 pKa = 4.13SLEE169 pKa = 3.98PEE171 pKa = 4.45PVTEE175 pKa = 3.93PVYY178 pKa = 10.59FEE180 pKa = 3.68PVKK183 pKa = 10.49PVFEE187 pKa = 4.7PEE189 pKa = 4.1FVTDD193 pKa = 3.79PVVAEE198 pKa = 4.49PVFGTQPVKK207 pKa = 10.41PVAEE211 pKa = 4.32PPVAEE216 pKa = 4.11PVVKK220 pKa = 10.11PVFEE224 pKa = 4.35PVAEE228 pKa = 4.05PVKK231 pKa = 10.31PVAEE235 pKa = 4.01PVVKK239 pKa = 10.01PVFEE243 pKa = 4.25VEE245 pKa = 4.2EE246 pKa = 4.35NFDD249 pKa = 3.26IARR252 pKa = 11.84QIEE255 pKa = 4.72MINTEE260 pKa = 4.05QVQISQLQTVQKK272 pKa = 11.15AEE274 pKa = 3.95IPVDD278 pKa = 4.43FSALKK283 pKa = 9.98HH284 pKa = 5.22IHH286 pKa = 6.03HH287 pKa = 6.52TTFTIQEE294 pKa = 4.1IEE296 pKa = 4.06SGIVDD301 pKa = 3.32EE302 pKa = 4.84HH303 pKa = 7.86FEE305 pKa = 4.43IRR307 pKa = 11.84GQHH310 pKa = 7.09DD311 pKa = 3.81ISCHH315 pKa = 4.88KK316 pKa = 10.67
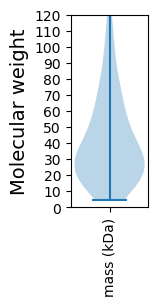
Molecular weight: 35.67 kDa
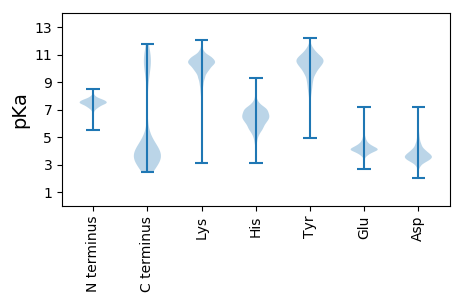
Isoelectric point according different methods:
Protein with the highest isoelectric point:
>tr|A0A0A8E7D3|A0A0A8E7D3_MYCFL Ribosomal RNA small subunit methyltransferase G OS=Mycoplasma flocculare ATCC 27399 OX=743971 GN=gidB PE=3 SV=1
MM1 pKa = 7.37ARR3 pKa = 11.84KK4 pKa = 9.96DD5 pKa = 3.99PISQRR10 pKa = 11.84GPLSGNNRR18 pKa = 11.84SHH20 pKa = 7.23ALNATKK26 pKa = 10.38RR27 pKa = 11.84KK28 pKa = 9.59FNLNLQQVTIKK39 pKa = 9.49TASRR43 pKa = 11.84QKK45 pKa = 10.3IRR47 pKa = 11.84LKK49 pKa = 11.04VSTKK53 pKa = 7.89TKK55 pKa = 8.64KK56 pKa = 8.17TLRR59 pKa = 11.84KK60 pKa = 8.66WGQII64 pKa = 3.41
MM1 pKa = 7.37ARR3 pKa = 11.84KK4 pKa = 9.96DD5 pKa = 3.99PISQRR10 pKa = 11.84GPLSGNNRR18 pKa = 11.84SHH20 pKa = 7.23ALNATKK26 pKa = 10.38RR27 pKa = 11.84KK28 pKa = 9.59FNLNLQQVTIKK39 pKa = 9.49TASRR43 pKa = 11.84QKK45 pKa = 10.3IRR47 pKa = 11.84LKK49 pKa = 11.04VSTKK53 pKa = 7.89TKK55 pKa = 8.64KK56 pKa = 8.17TLRR59 pKa = 11.84KK60 pKa = 8.66WGQII64 pKa = 3.41
Molecular weight: 7.34 kDa
Isoelectric point according different methods:
Peptides (in silico digests for buttom-up proteomics)
Below you can find in silico digests of the whole proteome with Trypsin, Chymotrypsin, Trypsin+LysC, LysN, ArgC proteases suitable for different mass spec machines.| Try ESI |
 |
|---|
| ChTry ESI |
 |
|---|
| ArgC ESI |
 |
|---|
| LysN ESI |
 |
|---|
| TryLysC ESI |
 |
|---|
| Try MALDI |
 |
|---|
| ChTry MALDI |
 |
|---|
| ArgC MALDI |
 |
|---|
| LysN MALDI |
 |
|---|
| TryLysC MALDI |
 |
|---|
| Try LTQ |
 |
|---|
| ChTry LTQ |
 |
|---|
| ArgC LTQ |
 |
|---|
| LysN LTQ |
 |
|---|
| TryLysC LTQ |
 |
|---|
| Try MSlow |
 |
|---|
| ChTry MSlow |
 |
|---|
| ArgC MSlow |
 |
|---|
| LysN MSlow |
 |
|---|
| TryLysC MSlow |
 |
|---|
| Try MShigh |
 |
|---|
| ChTry MShigh |
 |
|---|
| ArgC MShigh |
 |
|---|
| LysN MShigh |
 |
|---|
| TryLysC MShigh |
 |
|---|
General Statistics
Number of major isoforms |
Number of additional isoforms |
Number of all proteins |
Number of amino acids |
Min. Seq. Length |
Max. Seq. Length |
Avg. Seq. Length |
Avg. Mol. Weight |
|---|---|---|---|---|---|---|---|
0 |
221749 |
37 |
3784 |
401.0 |
46.03 |
Amino acid frequency
Ala |
Cys |
Asp |
Glu |
Phe |
Gly |
His |
Ile |
Lys |
Leu |
|---|---|---|---|---|---|---|---|---|---|
5.337 ± 0.088 | 0.422 ± 0.028 |
4.663 ± 0.064 | 6.438 ± 0.091 |
6.887 ± 0.102 | 4.575 ± 0.097 |
1.273 ± 0.044 | 9.908 ± 0.146 |
10.755 ± 0.09 | 9.817 ± 0.075 |
Met |
Asn |
Gln |
Pro |
Arg |
Ser |
Thr |
Val |
Trp |
Tyr |
|---|---|---|---|---|---|---|---|---|---|
1.223 ± 0.042 | 7.69 ± 0.118 |
2.959 ± 0.049 | 3.931 ± 0.073 |
2.905 ± 0.06 | 7.108 ± 0.101 |
4.668 ± 0.076 | 4.86 ± 0.064 |
0.952 ± 0.031 | 3.628 ± 0.065 |
Most of the basic statistics you can see at this page can be downloaded from this CSV file
Proteome-pI is available under Creative Commons Attribution-NoDerivs license, for more details see here
| Reference: Kozlowski LP. Proteome-pI 2.0: Proteome Isoelectric Point Database Update. Nucleic Acids Res. 2021, doi: 10.1093/nar/gkab944 | Contact: Lukasz P. Kozlowski |
