Mixia osmundae (strain CBS 9802 / IAM 14324 / JCM 22182 / KY 12970)
Taxonomy: cellular organisms; Eukaryota; Opisthokonta; Fungi; Dikarya; Basidiomycota; Pucciniomycotina; Mixiomycetes; Mixiales; Mixiaceae; Mixia; Mixia osmundae
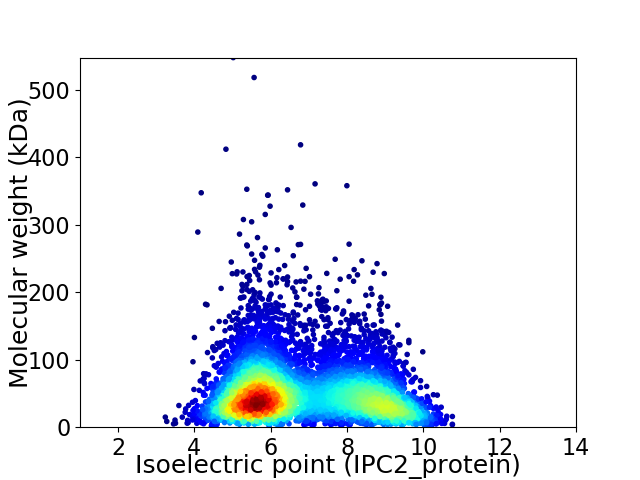
Average proteome isoelectric point is 6.83
Get precalculated fractions of proteins

Virtual 2D-PAGE plot for 6725 proteins (isoelectric point calculated using IPC2_protein)
Get csv file with sequences according to given criteria:
* You can choose from 21 different methods for calculating isoelectric point
Summary statistics related to proteome-wise predictions


Protein with the lowest isoelectric point:
>tr|G7E4A3|G7E4A3_MIXOS Cytochrome b5 heme-binding domain-containing protein OS=Mixia osmundae (strain CBS 9802 / IAM 14324 / JCM 22182 / KY 12970) OX=764103 GN=Mo04341 PE=4 SV=1
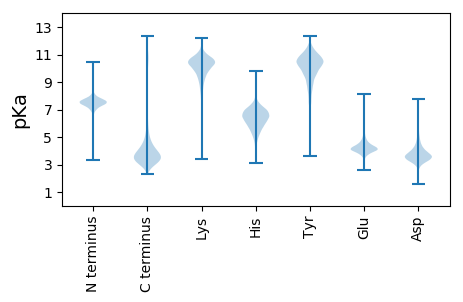
MM1 pKa = 7.66KK2 pKa = 9.53LTMLMLMTLALLAAARR18 pKa = 11.84PQDD21 pKa = 4.3DD22 pKa = 5.02GGDD25 pKa = 3.71DD26 pKa = 6.16DD27 pKa = 5.63YY28 pKa = 12.13DD29 pKa = 5.99CDD31 pKa = 5.85DD32 pKa = 5.08FDD34 pKa = 4.3NQADD38 pKa = 3.91CRR40 pKa = 11.84AHH42 pKa = 7.15SDD44 pKa = 4.19CKK46 pKa = 9.55WFPYY50 pKa = 10.09GCEE53 pKa = 3.68
MM1 pKa = 7.66KK2 pKa = 9.53LTMLMLMTLALLAAARR18 pKa = 11.84PQDD21 pKa = 4.3DD22 pKa = 5.02GGDD25 pKa = 3.71DD26 pKa = 6.16DD27 pKa = 5.63YY28 pKa = 12.13DD29 pKa = 5.99CDD31 pKa = 5.85DD32 pKa = 5.08FDD34 pKa = 4.3NQADD38 pKa = 3.91CRR40 pKa = 11.84AHH42 pKa = 7.15SDD44 pKa = 4.19CKK46 pKa = 9.55WFPYY50 pKa = 10.09GCEE53 pKa = 3.68
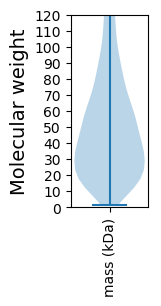
Molecular weight: 5.99 kDa
Isoelectric point according different methods:
Protein with the highest isoelectric point:
>tr|G7E9S1|G7E9S1_MIXOS Uncharacterized protein OS=Mixia osmundae (strain CBS 9802 / IAM 14324 / JCM 22182 / KY 12970) OX=764103 GN=Mo06087 PE=4 SV=1
MM1 pKa = 7.36QSALLDD7 pKa = 3.94SVLLLSVPALICWRR21 pKa = 11.84PRR23 pKa = 11.84RR24 pKa = 11.84TSSSEE29 pKa = 3.57GGIMDD34 pKa = 4.8SLLDD38 pKa = 3.74FAGNALSFVLLILATVLFIGFVTGSVMLFEE68 pKa = 5.87RR69 pKa = 11.84ISAYY73 pKa = 10.53VSGPAPVVTNRR84 pKa = 11.84NRR86 pKa = 11.84ATDD89 pKa = 3.65RR90 pKa = 11.84AQHH93 pKa = 4.72HH94 pKa = 5.84TEE96 pKa = 4.28RR97 pKa = 11.84ISVVVITIMLTLSFWWFPALFNAFNDD123 pKa = 3.67WLQLRR128 pKa = 11.84PRR130 pKa = 11.84KK131 pKa = 9.87DD132 pKa = 3.29AVPVKK137 pKa = 10.12IIEE140 pKa = 4.27RR141 pKa = 11.84PVIRR145 pKa = 11.84QFRR148 pKa = 11.84SVLDD152 pKa = 3.83PCWNSSTGQIIISLGLMIVIVVYY175 pKa = 10.69ISHH178 pKa = 5.89SHH180 pKa = 5.98SGDD183 pKa = 3.03VAAKK187 pKa = 9.49RR188 pKa = 11.84KK189 pKa = 8.88PIPPPAQPFKK199 pKa = 10.88RR200 pKa = 11.84RR201 pKa = 11.84VDD203 pKa = 3.88LPPTFTQLADD213 pKa = 3.61PRR215 pKa = 11.84KK216 pKa = 8.87HH217 pKa = 5.77ARR219 pKa = 11.84TRR221 pKa = 11.84HH222 pKa = 3.99EE223 pKa = 4.15HH224 pKa = 4.67MHH226 pKa = 6.6LGAIFKK232 pKa = 10.74ASDD235 pKa = 3.29GQTTYY240 pKa = 10.63TNPSGPRR247 pKa = 11.84LLAFQATKK255 pKa = 10.49RR256 pKa = 11.84RR257 pKa = 11.84RR258 pKa = 11.84LFYY261 pKa = 10.6LRR263 pKa = 11.84PAQLSQAQRR272 pKa = 11.84ARR274 pKa = 11.84SGLLIHH280 pKa = 7.25DD281 pKa = 4.71LQWGCKK287 pKa = 6.74TAGCIHH293 pKa = 7.22RR294 pKa = 11.84KK295 pKa = 8.23QGVRR299 pKa = 11.84EE300 pKa = 3.89AHH302 pKa = 6.95KK303 pKa = 10.56ISTSPGWSHH312 pKa = 8.04DD313 pKa = 3.2IGQLGPSSGGSSMVCGCFEE332 pKa = 4.43GKK334 pKa = 10.26ASPVLATRR342 pKa = 11.84VTRR345 pKa = 11.84CYY347 pKa = 11.12
MM1 pKa = 7.36QSALLDD7 pKa = 3.94SVLLLSVPALICWRR21 pKa = 11.84PRR23 pKa = 11.84RR24 pKa = 11.84TSSSEE29 pKa = 3.57GGIMDD34 pKa = 4.8SLLDD38 pKa = 3.74FAGNALSFVLLILATVLFIGFVTGSVMLFEE68 pKa = 5.87RR69 pKa = 11.84ISAYY73 pKa = 10.53VSGPAPVVTNRR84 pKa = 11.84NRR86 pKa = 11.84ATDD89 pKa = 3.65RR90 pKa = 11.84AQHH93 pKa = 4.72HH94 pKa = 5.84TEE96 pKa = 4.28RR97 pKa = 11.84ISVVVITIMLTLSFWWFPALFNAFNDD123 pKa = 3.67WLQLRR128 pKa = 11.84PRR130 pKa = 11.84KK131 pKa = 9.87DD132 pKa = 3.29AVPVKK137 pKa = 10.12IIEE140 pKa = 4.27RR141 pKa = 11.84PVIRR145 pKa = 11.84QFRR148 pKa = 11.84SVLDD152 pKa = 3.83PCWNSSTGQIIISLGLMIVIVVYY175 pKa = 10.69ISHH178 pKa = 5.89SHH180 pKa = 5.98SGDD183 pKa = 3.03VAAKK187 pKa = 9.49RR188 pKa = 11.84KK189 pKa = 8.88PIPPPAQPFKK199 pKa = 10.88RR200 pKa = 11.84RR201 pKa = 11.84VDD203 pKa = 3.88LPPTFTQLADD213 pKa = 3.61PRR215 pKa = 11.84KK216 pKa = 8.87HH217 pKa = 5.77ARR219 pKa = 11.84TRR221 pKa = 11.84HH222 pKa = 3.99EE223 pKa = 4.15HH224 pKa = 4.67MHH226 pKa = 6.6LGAIFKK232 pKa = 10.74ASDD235 pKa = 3.29GQTTYY240 pKa = 10.63TNPSGPRR247 pKa = 11.84LLAFQATKK255 pKa = 10.49RR256 pKa = 11.84RR257 pKa = 11.84RR258 pKa = 11.84LFYY261 pKa = 10.6LRR263 pKa = 11.84PAQLSQAQRR272 pKa = 11.84ARR274 pKa = 11.84SGLLIHH280 pKa = 7.25DD281 pKa = 4.71LQWGCKK287 pKa = 6.74TAGCIHH293 pKa = 7.22RR294 pKa = 11.84KK295 pKa = 8.23QGVRR299 pKa = 11.84EE300 pKa = 3.89AHH302 pKa = 6.95KK303 pKa = 10.56ISTSPGWSHH312 pKa = 8.04DD313 pKa = 3.2IGQLGPSSGGSSMVCGCFEE332 pKa = 4.43GKK334 pKa = 10.26ASPVLATRR342 pKa = 11.84VTRR345 pKa = 11.84CYY347 pKa = 11.12
Molecular weight: 38.51 kDa
Isoelectric point according different methods:
Peptides (in silico digests for buttom-up proteomics)
Below you can find in silico digests of the whole proteome with Trypsin, Chymotrypsin, Trypsin+LysC, LysN, ArgC proteases suitable for different mass spec machines.| Try ESI |
 |
|---|
| ChTry ESI |
 |
|---|
| ArgC ESI |
 |
|---|
| LysN ESI |
 |
|---|
| TryLysC ESI |
 |
|---|
| Try MALDI |
 |
|---|
| ChTry MALDI |
 |
|---|
| ArgC MALDI |
 |
|---|
| LysN MALDI |
 |
|---|
| TryLysC MALDI |
 |
|---|
| Try LTQ |
 |
|---|
| ChTry LTQ |
 |
|---|
| ArgC LTQ |
 |
|---|
| LysN LTQ |
 |
|---|
| TryLysC LTQ |
 |
|---|
| Try MSlow |
 |
|---|
| ChTry MSlow |
 |
|---|
| ArgC MSlow |
 |
|---|
| LysN MSlow |
 |
|---|
| TryLysC MSlow |
 |
|---|
| Try MShigh |
 |
|---|
| ChTry MShigh |
 |
|---|
| ArgC MShigh |
 |
|---|
| LysN MShigh |
 |
|---|
| TryLysC MShigh |
 |
|---|
General Statistics
Number of major isoforms |
Number of additional isoforms |
Number of all proteins |
Number of amino acids |
Min. Seq. Length |
Max. Seq. Length |
Avg. Seq. Length |
Avg. Mol. Weight |
|---|---|---|---|---|---|---|---|
0 |
3482161 |
9 |
5000 |
517.8 |
56.78 |
Amino acid frequency
Ala |
Cys |
Asp |
Glu |
Phe |
Gly |
His |
Ile |
Lys |
Leu |
|---|---|---|---|---|---|---|---|---|---|
10.478 ± 0.027 | 1.213 ± 0.012 |
5.775 ± 0.017 | 5.488 ± 0.023 |
3.232 ± 0.016 | 6.156 ± 0.023 |
2.456 ± 0.013 | 4.534 ± 0.019 |
4.299 ± 0.024 | 9.551 ± 0.03 |
Met |
Asn |
Gln |
Pro |
Arg |
Ser |
Thr |
Val |
Trp |
Tyr |
|---|---|---|---|---|---|---|---|---|---|
1.996 ± 0.01 | 2.862 ± 0.013 |
5.976 ± 0.03 | 4.367 ± 0.02 |
6.74 ± 0.023 | 9.294 ± 0.045 |
6.091 ± 0.022 | 5.819 ± 0.019 |
1.182 ± 0.01 | 2.493 ± 0.015 |
Most of the basic statistics you can see at this page can be downloaded from this CSV file
Proteome-pI is available under Creative Commons Attribution-NoDerivs license, for more details see here
| Reference: Kozlowski LP. Proteome-pI 2.0: Proteome Isoelectric Point Database Update. Nucleic Acids Res. 2021, doi: 10.1093/nar/gkab944 | Contact: Lukasz P. Kozlowski |
