ANMV-1 virus
Taxonomy: Viruses; unclassified archaeal viruses
Average proteome isoelectric point is 6.52
Get precalculated fractions of proteins

Virtual 2D-PAGE plot for 69 proteins (isoelectric point calculated using IPC2_protein)
Get csv file with sequences according to given criteria:
* You can choose from 21 different methods for calculating isoelectric point
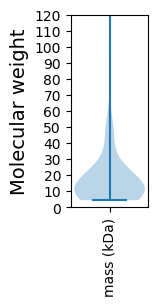
Summary statistics related to proteome-wise predictions


Protein with the lowest isoelectric point:
>tr|A0A0C5KMN7|A0A0C5KMN7_9VIRU Uncharacterized protein OS=ANMV-1 virus OX=1605378 PE=4 SV=1
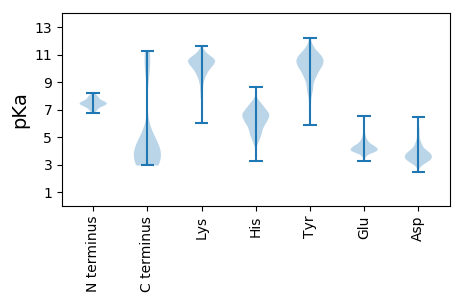
MM1 pKa = 7.97DD2 pKa = 5.53PAPGKK7 pKa = 10.52VEE9 pKa = 4.02ADD11 pKa = 3.38RR12 pKa = 11.84AGWFVRR18 pKa = 11.84DD19 pKa = 3.65YY20 pKa = 10.97FPDD23 pKa = 3.65GVAPVSKK30 pKa = 10.27ILFDD34 pKa = 3.92GAGSGTGIDD43 pKa = 3.94FASTAFTTGIDD54 pKa = 3.24ISGTCVTGISMTNASAVGILVKK76 pKa = 10.46AGPMGFDD83 pKa = 2.95ITSTIPAGAATNANEE98 pKa = 5.15LNLTDD103 pKa = 5.36DD104 pKa = 4.07STGSSGLARR113 pKa = 11.84ALWINAVVAGDD124 pKa = 3.45KK125 pKa = 10.62TGTGEE130 pKa = 4.21HH131 pKa = 6.49NSFGIDD137 pKa = 3.15QHH139 pKa = 5.4VTGDD143 pKa = 3.5TPYY146 pKa = 10.65LYY148 pKa = 11.29GMTYY152 pKa = 10.49YY153 pKa = 10.66SYY155 pKa = 10.2DD156 pKa = 3.33TGDD159 pKa = 3.43PTIGFAAPISIYY171 pKa = 10.47QDD173 pKa = 3.5DD174 pKa = 4.63LGTNIGAYY182 pKa = 9.83VGIDD186 pKa = 3.0IGIALSNPPTDD197 pKa = 3.51RR198 pKa = 11.84YY199 pKa = 10.55SFMRR203 pKa = 11.84FRR205 pKa = 11.84EE206 pKa = 3.94HH207 pKa = 5.63STAVPKK213 pKa = 10.76SVFRR217 pKa = 11.84FEE219 pKa = 4.39GAHH222 pKa = 5.98CASHH226 pKa = 6.86LFDD229 pKa = 3.57VTAGTGMPDD238 pKa = 4.74FITTEE243 pKa = 3.79AGATFAGDD251 pKa = 4.14GIKK254 pKa = 10.05IAVEE258 pKa = 4.2YY259 pKa = 10.82QGTTYY264 pKa = 11.16YY265 pKa = 10.94LRR267 pKa = 11.84ACSAFSS273 pKa = 3.19
MM1 pKa = 7.97DD2 pKa = 5.53PAPGKK7 pKa = 10.52VEE9 pKa = 4.02ADD11 pKa = 3.38RR12 pKa = 11.84AGWFVRR18 pKa = 11.84DD19 pKa = 3.65YY20 pKa = 10.97FPDD23 pKa = 3.65GVAPVSKK30 pKa = 10.27ILFDD34 pKa = 3.92GAGSGTGIDD43 pKa = 3.94FASTAFTTGIDD54 pKa = 3.24ISGTCVTGISMTNASAVGILVKK76 pKa = 10.46AGPMGFDD83 pKa = 2.95ITSTIPAGAATNANEE98 pKa = 5.15LNLTDD103 pKa = 5.36DD104 pKa = 4.07STGSSGLARR113 pKa = 11.84ALWINAVVAGDD124 pKa = 3.45KK125 pKa = 10.62TGTGEE130 pKa = 4.21HH131 pKa = 6.49NSFGIDD137 pKa = 3.15QHH139 pKa = 5.4VTGDD143 pKa = 3.5TPYY146 pKa = 10.65LYY148 pKa = 11.29GMTYY152 pKa = 10.49YY153 pKa = 10.66SYY155 pKa = 10.2DD156 pKa = 3.33TGDD159 pKa = 3.43PTIGFAAPISIYY171 pKa = 10.47QDD173 pKa = 3.5DD174 pKa = 4.63LGTNIGAYY182 pKa = 9.83VGIDD186 pKa = 3.0IGIALSNPPTDD197 pKa = 3.51RR198 pKa = 11.84YY199 pKa = 10.55SFMRR203 pKa = 11.84FRR205 pKa = 11.84EE206 pKa = 3.94HH207 pKa = 5.63STAVPKK213 pKa = 10.76SVFRR217 pKa = 11.84FEE219 pKa = 4.39GAHH222 pKa = 5.98CASHH226 pKa = 6.86LFDD229 pKa = 3.57VTAGTGMPDD238 pKa = 4.74FITTEE243 pKa = 3.79AGATFAGDD251 pKa = 4.14GIKK254 pKa = 10.05IAVEE258 pKa = 4.2YY259 pKa = 10.82QGTTYY264 pKa = 11.16YY265 pKa = 10.94LRR267 pKa = 11.84ACSAFSS273 pKa = 3.19
Molecular weight: 28.44 kDa
Isoelectric point according different methods:
Protein with the highest isoelectric point:
>tr|A0A0C5K865|A0A0C5K865_9VIRU Uncharacterized protein OS=ANMV-1 virus OX=1605378 PE=4 SV=1
MM1 pKa = 7.8GEE3 pKa = 4.97RR4 pKa = 11.84YY5 pKa = 9.99YY6 pKa = 10.92KK7 pKa = 10.32WEE9 pKa = 4.19DD10 pKa = 3.15ALIIKK15 pKa = 7.95YY16 pKa = 10.11YY17 pKa = 8.27PTAARR22 pKa = 11.84EE23 pKa = 3.95KK24 pKa = 9.01MLEE27 pKa = 4.08HH28 pKa = 6.41VPTRR32 pKa = 11.84TWSQIGLRR40 pKa = 11.84ARR42 pKa = 11.84ALGIHH47 pKa = 6.21RR48 pKa = 11.84TTKK51 pKa = 10.37AWGDD55 pKa = 3.86SIRR58 pKa = 11.84EE59 pKa = 3.97GRR61 pKa = 11.84KK62 pKa = 9.4GLRR65 pKa = 11.84GTWDD69 pKa = 3.35DD70 pKa = 3.58VDD72 pKa = 4.37NEE74 pKa = 4.4RR75 pKa = 11.84LDD77 pKa = 3.69YY78 pKa = 9.91MYY80 pKa = 8.26PTATRR85 pKa = 11.84AQLRR89 pKa = 11.84VAFPSRR95 pKa = 11.84TWLSLQSHH103 pKa = 5.41AQKK106 pKa = 10.62RR107 pKa = 11.84HH108 pKa = 3.5IHH110 pKa = 5.05RR111 pKa = 11.84TRR113 pKa = 11.84EE114 pKa = 3.8AVGRR118 pKa = 11.84QISIGRR124 pKa = 11.84RR125 pKa = 11.84DD126 pKa = 3.35GRR128 pKa = 11.84KK129 pKa = 9.54NEE131 pKa = 3.88
MM1 pKa = 7.8GEE3 pKa = 4.97RR4 pKa = 11.84YY5 pKa = 9.99YY6 pKa = 10.92KK7 pKa = 10.32WEE9 pKa = 4.19DD10 pKa = 3.15ALIIKK15 pKa = 7.95YY16 pKa = 10.11YY17 pKa = 8.27PTAARR22 pKa = 11.84EE23 pKa = 3.95KK24 pKa = 9.01MLEE27 pKa = 4.08HH28 pKa = 6.41VPTRR32 pKa = 11.84TWSQIGLRR40 pKa = 11.84ARR42 pKa = 11.84ALGIHH47 pKa = 6.21RR48 pKa = 11.84TTKK51 pKa = 10.37AWGDD55 pKa = 3.86SIRR58 pKa = 11.84EE59 pKa = 3.97GRR61 pKa = 11.84KK62 pKa = 9.4GLRR65 pKa = 11.84GTWDD69 pKa = 3.35DD70 pKa = 3.58VDD72 pKa = 4.37NEE74 pKa = 4.4RR75 pKa = 11.84LDD77 pKa = 3.69YY78 pKa = 9.91MYY80 pKa = 8.26PTATRR85 pKa = 11.84AQLRR89 pKa = 11.84VAFPSRR95 pKa = 11.84TWLSLQSHH103 pKa = 5.41AQKK106 pKa = 10.62RR107 pKa = 11.84HH108 pKa = 3.5IHH110 pKa = 5.05RR111 pKa = 11.84TRR113 pKa = 11.84EE114 pKa = 3.8AVGRR118 pKa = 11.84QISIGRR124 pKa = 11.84RR125 pKa = 11.84DD126 pKa = 3.35GRR128 pKa = 11.84KK129 pKa = 9.54NEE131 pKa = 3.88
Molecular weight: 15.48 kDa
Isoelectric point according different methods:
Peptides (in silico digests for buttom-up proteomics)
Below you can find in silico digests of the whole proteome with Trypsin, Chymotrypsin, Trypsin+LysC, LysN, ArgC proteases suitable for different mass spec machines.| Try ESI |
 |
|---|
| ChTry ESI |
 |
|---|
| ArgC ESI |
 |
|---|
| LysN ESI |
 |
|---|
| TryLysC ESI |
 |
|---|
| Try MALDI |
 |
|---|
| ChTry MALDI |
 |
|---|
| ArgC MALDI |
 |
|---|
| LysN MALDI |
 |
|---|
| TryLysC MALDI |
 |
|---|
| Try LTQ |
 |
|---|
| ChTry LTQ |
 |
|---|
| ArgC LTQ |
 |
|---|
| LysN LTQ |
 |
|---|
| TryLysC LTQ |
 |
|---|
| Try MSlow |
 |
|---|
| ChTry MSlow |
 |
|---|
| ArgC MSlow |
 |
|---|
| LysN MSlow |
 |
|---|
| TryLysC MSlow |
 |
|---|
| Try MShigh |
 |
|---|
| ChTry MShigh |
 |
|---|
| ArgC MShigh |
 |
|---|
| LysN MShigh |
 |
|---|
| TryLysC MShigh |
 |
|---|
General Statistics
Number of major isoforms |
Number of additional isoforms |
Number of all proteins |
Number of amino acids |
Min. Seq. Length |
Max. Seq. Length |
Avg. Seq. Length |
Avg. Mol. Weight |
|---|---|---|---|---|---|---|---|
0 |
11327 |
37 |
1166 |
164.2 |
18.61 |
Amino acid frequency
Ala |
Cys |
Asp |
Glu |
Phe |
Gly |
His |
Ile |
Lys |
Leu |
|---|---|---|---|---|---|---|---|---|---|
7.01 ± 0.456 | 2.702 ± 1.023 |
6.551 ± 0.404 | 8.14 ± 0.5 |
3.69 ± 0.304 | 6.833 ± 0.375 |
2.693 ± 0.213 | 6.224 ± 0.353 |
7.292 ± 0.517 | 7.637 ± 0.482 |
Met |
Asn |
Gln |
Pro |
Arg |
Ser |
Thr |
Val |
Trp |
Tyr |
|---|---|---|---|---|---|---|---|---|---|
2.092 ± 0.146 | 4.043 ± 0.256 |
3.893 ± 0.206 | 2.86 ± 0.177 |
5.747 ± 0.379 | 5.315 ± 0.275 |
5.862 ± 0.449 | 6.145 ± 0.308 |
1.571 ± 0.142 | 3.699 ± 0.191 |
Most of the basic statistics you can see at this page can be downloaded from this CSV file
Proteome-pI is available under Creative Commons Attribution-NoDerivs license, for more details see here
| Reference: Kozlowski LP. Proteome-pI 2.0: Proteome Isoelectric Point Database Update. Nucleic Acids Res. 2021, doi: 10.1093/nar/gkab944 | Contact: Lukasz P. Kozlowski |
