Pseudoalteromonas phage PM2 (Bacteriophage PM2)
Taxonomy: Viruses; Varidnaviria; Bamfordvirae; Preplasmiviricota; Tectiliviricetes; Vinavirales; Corticoviridae; Corticovirus
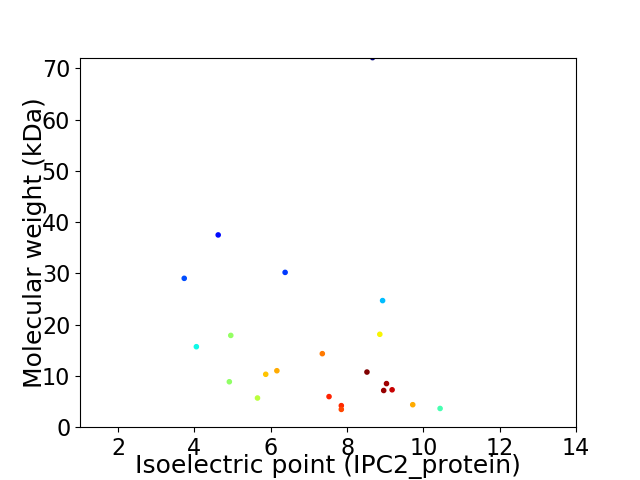
Average proteome isoelectric point is 7.31
Get precalculated fractions of proteins

Virtual 2D-PAGE plot for 22 proteins (isoelectric point calculated using IPC2_protein)
Get csv file with sequences according to given criteria:
* You can choose from 21 different methods for calculating isoelectric point
Summary statistics related to proteome-wise predictions


Protein with the lowest isoelectric point:
>sp|Q9XJR5|P8_BPPM2 Protein P8 OS=Pseudoalteromonas phage PM2 OX=10661 GN=VIII PE=1 SV=1
MM1 pKa = 7.42GLFGGGNSKK10 pKa = 8.78STSNQTTNNEE20 pKa = 3.93NTNIATQGDD29 pKa = 3.83NLGAVINGNGNSVTMTDD46 pKa = 3.48HH47 pKa = 6.6GLVDD51 pKa = 3.98ALVDD55 pKa = 3.18IGGYY59 pKa = 9.31MSDD62 pKa = 3.17STQAAFGAASDD73 pKa = 3.77MAYY76 pKa = 10.74SSTEE80 pKa = 3.65FAGQAITDD88 pKa = 3.78GFDD91 pKa = 3.09YY92 pKa = 11.48AEE94 pKa = 4.28GVNRR98 pKa = 11.84DD99 pKa = 3.93SLDD102 pKa = 3.17MAEE105 pKa = 4.81GINRR109 pKa = 11.84DD110 pKa = 3.38SLNFGRR116 pKa = 11.84DD117 pKa = 3.44ALSVTGDD124 pKa = 3.47LMTDD128 pKa = 3.25AMQYY132 pKa = 10.92SSDD135 pKa = 3.54AMLASIEE142 pKa = 4.31GNAGLAGQVMDD153 pKa = 5.21ASTTMTGQSLNFGLDD168 pKa = 3.41TFSGAMDD175 pKa = 4.72SLNQSNNNMALLAEE189 pKa = 4.55FTSNQSTDD197 pKa = 3.25LARR200 pKa = 11.84DD201 pKa = 3.41SMAFGADD208 pKa = 4.62LMAQYY213 pKa = 10.6QDD215 pKa = 4.3NISASNYY222 pKa = 8.66DD223 pKa = 3.5ARR225 pKa = 11.84EE226 pKa = 3.96HH227 pKa = 6.24MLDD230 pKa = 3.3ASKK233 pKa = 9.19TAMQFADD240 pKa = 3.2NMSRR244 pKa = 11.84SDD246 pKa = 3.69GQQLAKK252 pKa = 10.69DD253 pKa = 3.85SNKK256 pKa = 9.27TLMIGIVAVSAAVGLYY272 pKa = 10.45AISKK276 pKa = 9.22GVNN279 pKa = 2.97
MM1 pKa = 7.42GLFGGGNSKK10 pKa = 8.78STSNQTTNNEE20 pKa = 3.93NTNIATQGDD29 pKa = 3.83NLGAVINGNGNSVTMTDD46 pKa = 3.48HH47 pKa = 6.6GLVDD51 pKa = 3.98ALVDD55 pKa = 3.18IGGYY59 pKa = 9.31MSDD62 pKa = 3.17STQAAFGAASDD73 pKa = 3.77MAYY76 pKa = 10.74SSTEE80 pKa = 3.65FAGQAITDD88 pKa = 3.78GFDD91 pKa = 3.09YY92 pKa = 11.48AEE94 pKa = 4.28GVNRR98 pKa = 11.84DD99 pKa = 3.93SLDD102 pKa = 3.17MAEE105 pKa = 4.81GINRR109 pKa = 11.84DD110 pKa = 3.38SLNFGRR116 pKa = 11.84DD117 pKa = 3.44ALSVTGDD124 pKa = 3.47LMTDD128 pKa = 3.25AMQYY132 pKa = 10.92SSDD135 pKa = 3.54AMLASIEE142 pKa = 4.31GNAGLAGQVMDD153 pKa = 5.21ASTTMTGQSLNFGLDD168 pKa = 3.41TFSGAMDD175 pKa = 4.72SLNQSNNNMALLAEE189 pKa = 4.55FTSNQSTDD197 pKa = 3.25LARR200 pKa = 11.84DD201 pKa = 3.41SMAFGADD208 pKa = 4.62LMAQYY213 pKa = 10.6QDD215 pKa = 4.3NISASNYY222 pKa = 8.66DD223 pKa = 3.5ARR225 pKa = 11.84EE226 pKa = 3.96HH227 pKa = 6.24MLDD230 pKa = 3.3ASKK233 pKa = 9.19TAMQFADD240 pKa = 3.2NMSRR244 pKa = 11.84SDD246 pKa = 3.69GQQLAKK252 pKa = 10.69DD253 pKa = 3.85SNKK256 pKa = 9.27TLMIGIVAVSAAVGLYY272 pKa = 10.45AISKK276 pKa = 9.22GVNN279 pKa = 2.97
Molecular weight: 29.04 kDa
Isoelectric point according different methods:
Protein with the highest isoelectric point:
>sp|Q9XJR9|P9_BPPM2 Protein P9 OS=Pseudoalteromonas phage PM2 OX=10661 GN=IX PE=1 SV=2
MM1 pKa = 7.49INKK4 pKa = 7.38TTIKK8 pKa = 9.8TVLITLGVLAAVNKK22 pKa = 9.54VSALRR27 pKa = 11.84SVKK30 pKa = 10.4RR31 pKa = 11.84LISS34 pKa = 3.49
MM1 pKa = 7.49INKK4 pKa = 7.38TTIKK8 pKa = 9.8TVLITLGVLAAVNKK22 pKa = 9.54VSALRR27 pKa = 11.84SVKK30 pKa = 10.4RR31 pKa = 11.84LISS34 pKa = 3.49
Molecular weight: 3.65 kDa
Isoelectric point according different methods:
Peptides (in silico digests for buttom-up proteomics)
Below you can find in silico digests of the whole proteome with Trypsin, Chymotrypsin, Trypsin+LysC, LysN, ArgC proteases suitable for different mass spec machines.| Try ESI |
 |
|---|
| ChTry ESI |
 |
|---|
| ArgC ESI |
 |
|---|
| LysN ESI |
 |
|---|
| TryLysC ESI |
 |
|---|
| Try MALDI |
 |
|---|
| ChTry MALDI |
 |
|---|
| ArgC MALDI |
 |
|---|
| LysN MALDI |
 |
|---|
| TryLysC MALDI |
 |
|---|
| Try LTQ |
 |
|---|
| ChTry LTQ |
 |
|---|
| ArgC LTQ |
 |
|---|
| LysN LTQ |
 |
|---|
| TryLysC LTQ |
 |
|---|
| Try MSlow |
 |
|---|
| ChTry MSlow |
 |
|---|
| ArgC MSlow |
 |
|---|
| LysN MSlow |
 |
|---|
| TryLysC MSlow |
 |
|---|
| Try MShigh |
 |
|---|
| ChTry MShigh |
 |
|---|
| ArgC MShigh |
 |
|---|
| LysN MShigh |
 |
|---|
| TryLysC MShigh |
 |
|---|
General Statistics
Number of major isoforms |
Number of additional isoforms |
Number of all proteins |
Number of amino acids |
Min. Seq. Length |
Max. Seq. Length |
Avg. Seq. Length |
Avg. Mol. Weight |
|---|---|---|---|---|---|---|---|
3156 |
30 |
634 |
143.5 |
15.95 |
Amino acid frequency
Ala |
Cys |
Asp |
Glu |
Phe |
Gly |
His |
Ile |
Lys |
Leu |
|---|---|---|---|---|---|---|---|---|---|
9.252 ± 0.603 | 0.887 ± 0.28 |
6.115 ± 0.771 | 6.274 ± 0.617 |
3.802 ± 0.292 | 7.003 ± 0.759 |
1.394 ± 0.168 | 5.894 ± 0.389 |
7.129 ± 0.77 | 8.809 ± 0.649 |
Met |
Asn |
Gln |
Pro |
Arg |
Ser |
Thr |
Val |
Trp |
Tyr |
|---|---|---|---|---|---|---|---|---|---|
3.105 ± 0.397 | 5.292 ± 0.491 |
3.074 ± 0.426 | 4.024 ± 0.362 |
4.943 ± 0.503 | 6.21 ± 0.571 |
5.767 ± 0.403 | 6.781 ± 0.681 |
1.267 ± 0.177 | 2.978 ± 0.372 |
Most of the basic statistics you can see at this page can be downloaded from this CSV file
Proteome-pI is available under Creative Commons Attribution-NoDerivs license, for more details see here
| Reference: Kozlowski LP. Proteome-pI 2.0: Proteome Isoelectric Point Database Update. Nucleic Acids Res. 2021, doi: 10.1093/nar/gkab944 | Contact: Lukasz P. Kozlowski |
