Hart Park virus
Taxonomy: Viruses; Riboviria; Orthornavirae; Negarnaviricota; Haploviricotina; Monjiviricetes; Mononegavirales; Rhabdoviridae; Alpharhabdovirinae; Hapavirus; Hart Park hapavirus
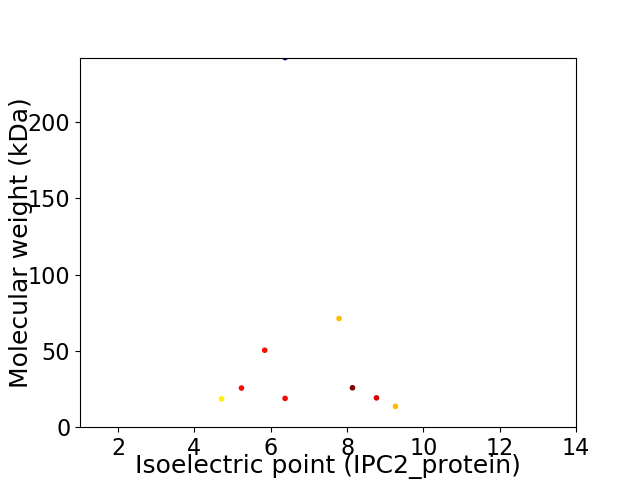
Average proteome isoelectric point is 6.85
Get precalculated fractions of proteins

Virtual 2D-PAGE plot for 9 proteins (isoelectric point calculated using IPC2_protein)
Get csv file with sequences according to given criteria:
* You can choose from 21 different methods for calculating isoelectric point
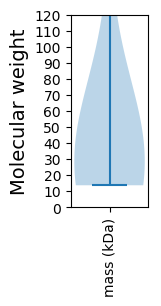
Summary statistics related to proteome-wise predictions


Protein with the lowest isoelectric point:
>tr|T2FGV0|T2FGV0_9RHAB U1 protein OS=Hart Park virus OX=200401 GN=U1 PE=4 SV=1
MM1 pKa = 8.02DD2 pKa = 5.85LYY4 pKa = 10.46IHH6 pKa = 6.96LGITFHH12 pKa = 6.94YY13 pKa = 9.77NGSYY17 pKa = 10.71LDD19 pKa = 3.87NDD21 pKa = 3.55NLNWIISRR29 pKa = 11.84MIYY32 pKa = 10.41DD33 pKa = 4.43CVRR36 pKa = 11.84EE37 pKa = 4.18SGVPGDD43 pKa = 3.8VAAFAINLAWEE54 pKa = 4.29HH55 pKa = 6.37VDD57 pKa = 3.05ICFDD61 pKa = 3.74SGNITHH67 pKa = 7.17GYY69 pKa = 9.48CWLQEE74 pKa = 4.02AVSLPGTPKK83 pKa = 10.94DD84 pKa = 3.96LDD86 pKa = 3.63KK87 pKa = 11.71LNNTFSSRR95 pKa = 11.84GSFFIQGDD103 pKa = 3.62EE104 pKa = 4.05DD105 pKa = 4.04LGEE108 pKa = 3.93VEE110 pKa = 5.16YY111 pKa = 10.62IFFVAEE117 pKa = 3.69PTLQEE122 pKa = 3.76GHH124 pKa = 6.69PWDD127 pKa = 4.6VVWHH131 pKa = 5.97PMFVDD136 pKa = 4.15PQAYY140 pKa = 9.38HH141 pKa = 7.0IKK143 pKa = 10.42RR144 pKa = 11.84NPDD147 pKa = 2.63VVAYY151 pKa = 9.49KK152 pKa = 10.5FRR154 pKa = 11.84FQHH157 pKa = 6.88LIHH160 pKa = 6.95PP161 pKa = 5.17
MM1 pKa = 8.02DD2 pKa = 5.85LYY4 pKa = 10.46IHH6 pKa = 6.96LGITFHH12 pKa = 6.94YY13 pKa = 9.77NGSYY17 pKa = 10.71LDD19 pKa = 3.87NDD21 pKa = 3.55NLNWIISRR29 pKa = 11.84MIYY32 pKa = 10.41DD33 pKa = 4.43CVRR36 pKa = 11.84EE37 pKa = 4.18SGVPGDD43 pKa = 3.8VAAFAINLAWEE54 pKa = 4.29HH55 pKa = 6.37VDD57 pKa = 3.05ICFDD61 pKa = 3.74SGNITHH67 pKa = 7.17GYY69 pKa = 9.48CWLQEE74 pKa = 4.02AVSLPGTPKK83 pKa = 10.94DD84 pKa = 3.96LDD86 pKa = 3.63KK87 pKa = 11.71LNNTFSSRR95 pKa = 11.84GSFFIQGDD103 pKa = 3.62EE104 pKa = 4.05DD105 pKa = 4.04LGEE108 pKa = 3.93VEE110 pKa = 5.16YY111 pKa = 10.62IFFVAEE117 pKa = 3.69PTLQEE122 pKa = 3.76GHH124 pKa = 6.69PWDD127 pKa = 4.6VVWHH131 pKa = 5.97PMFVDD136 pKa = 4.15PQAYY140 pKa = 9.38HH141 pKa = 7.0IKK143 pKa = 10.42RR144 pKa = 11.84NPDD147 pKa = 2.63VVAYY151 pKa = 9.49KK152 pKa = 10.5FRR154 pKa = 11.84FQHH157 pKa = 6.88LIHH160 pKa = 6.95PP161 pKa = 5.17
Molecular weight: 18.59 kDa
Isoelectric point according different methods:
Protein with the highest isoelectric point:
>tr|A0A0D3R1J5|A0A0D3R1J5_9RHAB Glycoprotein OS=Hart Park virus OX=200401 PE=4 SV=1
MM1 pKa = 7.38GFDD4 pKa = 3.13IGGDD8 pKa = 2.8IGKK11 pKa = 9.03PLKK14 pKa = 10.65DD15 pKa = 3.45AFDD18 pKa = 3.87KK19 pKa = 11.25FGADD23 pKa = 2.6IKK25 pKa = 9.46MTFLTVLNWMKK36 pKa = 10.06WISIGILIVISVILICKK53 pKa = 9.05IIKK56 pKa = 10.01VLFQCGKK63 pKa = 10.27CLLSCFGFCKK73 pKa = 10.35KK74 pKa = 9.83CVKK77 pKa = 10.35GNHH80 pKa = 4.7SHH82 pKa = 5.82MNKK85 pKa = 8.12TRR87 pKa = 11.84KK88 pKa = 9.03KK89 pKa = 7.91HH90 pKa = 4.24QFRR93 pKa = 11.84GKK95 pKa = 8.19VKK97 pKa = 10.4KK98 pKa = 8.1MTVPVIRR105 pKa = 11.84KK106 pKa = 8.55KK107 pKa = 10.94VKK109 pKa = 9.22IRR111 pKa = 11.84KK112 pKa = 9.21DD113 pKa = 3.27PSLVEE118 pKa = 4.02LVV120 pKa = 3.45
MM1 pKa = 7.38GFDD4 pKa = 3.13IGGDD8 pKa = 2.8IGKK11 pKa = 9.03PLKK14 pKa = 10.65DD15 pKa = 3.45AFDD18 pKa = 3.87KK19 pKa = 11.25FGADD23 pKa = 2.6IKK25 pKa = 9.46MTFLTVLNWMKK36 pKa = 10.06WISIGILIVISVILICKK53 pKa = 9.05IIKK56 pKa = 10.01VLFQCGKK63 pKa = 10.27CLLSCFGFCKK73 pKa = 10.35KK74 pKa = 9.83CVKK77 pKa = 10.35GNHH80 pKa = 4.7SHH82 pKa = 5.82MNKK85 pKa = 8.12TRR87 pKa = 11.84KK88 pKa = 9.03KK89 pKa = 7.91HH90 pKa = 4.24QFRR93 pKa = 11.84GKK95 pKa = 8.19VKK97 pKa = 10.4KK98 pKa = 8.1MTVPVIRR105 pKa = 11.84KK106 pKa = 8.55KK107 pKa = 10.94VKK109 pKa = 9.22IRR111 pKa = 11.84KK112 pKa = 9.21DD113 pKa = 3.27PSLVEE118 pKa = 4.02LVV120 pKa = 3.45
Molecular weight: 13.64 kDa
Isoelectric point according different methods:
Peptides (in silico digests for buttom-up proteomics)
Below you can find in silico digests of the whole proteome with Trypsin, Chymotrypsin, Trypsin+LysC, LysN, ArgC proteases suitable for different mass spec machines.| Try ESI |
 |
|---|
| ChTry ESI |
 |
|---|
| ArgC ESI |
 |
|---|
| LysN ESI |
 |
|---|
| TryLysC ESI |
 |
|---|
| Try MALDI |
 |
|---|
| ChTry MALDI |
 |
|---|
| ArgC MALDI |
 |
|---|
| LysN MALDI |
 |
|---|
| TryLysC MALDI |
 |
|---|
| Try LTQ |
 |
|---|
| ChTry LTQ |
 |
|---|
| ArgC LTQ |
 |
|---|
| LysN LTQ |
 |
|---|
| TryLysC LTQ |
 |
|---|
| Try MSlow |
 |
|---|
| ChTry MSlow |
 |
|---|
| ArgC MSlow |
 |
|---|
| LysN MSlow |
 |
|---|
| TryLysC MSlow |
 |
|---|
| Try MShigh |
 |
|---|
| ChTry MShigh |
 |
|---|
| ArgC MShigh |
 |
|---|
| LysN MShigh |
 |
|---|
| TryLysC MShigh |
 |
|---|
General Statistics
Number of major isoforms |
Number of additional isoforms |
Number of all proteins |
Number of amino acids |
Min. Seq. Length |
Max. Seq. Length |
Avg. Seq. Length |
Avg. Mol. Weight |
|---|---|---|---|---|---|---|---|
0 |
4224 |
120 |
2104 |
469.3 |
53.95 |
Amino acid frequency
Ala |
Cys |
Asp |
Glu |
Phe |
Gly |
His |
Ile |
Lys |
Leu |
|---|---|---|---|---|---|---|---|---|---|
3.859 ± 0.514 | 1.847 ± 0.228 |
5.611 ± 0.644 | 5.682 ± 0.387 |
4.498 ± 0.263 | 5.611 ± 0.522 |
2.438 ± 0.232 | 7.884 ± 0.312 |
6.818 ± 0.551 | 10.038 ± 0.974 |
Met |
Asn |
Gln |
Pro |
Arg |
Ser |
Thr |
Val |
Trp |
Tyr |
|---|---|---|---|---|---|---|---|---|---|
2.462 ± 0.344 | 5.8 ± 0.522 |
4.451 ± 0.484 | 3.717 ± 0.302 |
4.64 ± 0.248 | 8.002 ± 0.55 |
4.853 ± 0.39 | 5.469 ± 0.42 |
2.107 ± 0.233 | 4.214 ± 0.494 |
Most of the basic statistics you can see at this page can be downloaded from this CSV file
Proteome-pI is available under Creative Commons Attribution-NoDerivs license, for more details see here
| Reference: Kozlowski LP. Proteome-pI 2.0: Proteome Isoelectric Point Database Update. Nucleic Acids Res. 2021, doi: 10.1093/nar/gkab944 | Contact: Lukasz P. Kozlowski |
