Acidianus two-tailed virus (ATV)
Taxonomy: Viruses; Bicaudaviridae; Bicaudavirus
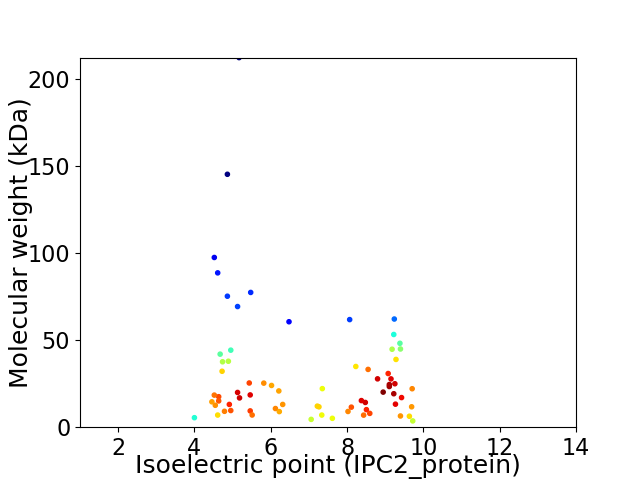
Average proteome isoelectric point is 6.95
Get precalculated fractions of proteins

Virtual 2D-PAGE plot for 72 proteins (isoelectric point calculated using IPC2_protein)
Get csv file with sequences according to given criteria:
* You can choose from 21 different methods for calculating isoelectric point
Summary statistics related to proteome-wise predictions


Protein with the lowest isoelectric point:
>sp|Q3V4T4|Y059A_ATV Uncharacterized protein ORF59a OS=Acidianus two-tailed virus OX=315953 PE=4 SV=1
MM1 pKa = 7.39NCLEE5 pKa = 4.09ILISKK10 pKa = 8.82GYY12 pKa = 10.49NMQGYY17 pKa = 9.6SPDD20 pKa = 3.6TLLLLSEE27 pKa = 4.58KK28 pKa = 10.28EE29 pKa = 4.21GNDD32 pKa = 3.4VEE34 pKa = 4.63EE35 pKa = 4.9CEE37 pKa = 6.09AYY39 pKa = 10.46FSWLEE44 pKa = 3.8AVYY47 pKa = 10.64GG48 pKa = 3.85
MM1 pKa = 7.39NCLEE5 pKa = 4.09ILISKK10 pKa = 8.82GYY12 pKa = 10.49NMQGYY17 pKa = 9.6SPDD20 pKa = 3.6TLLLLSEE27 pKa = 4.58KK28 pKa = 10.28EE29 pKa = 4.21GNDD32 pKa = 3.4VEE34 pKa = 4.63EE35 pKa = 4.9CEE37 pKa = 6.09AYY39 pKa = 10.46FSWLEE44 pKa = 3.8AVYY47 pKa = 10.64GG48 pKa = 3.85
Molecular weight: 5.47 kDa
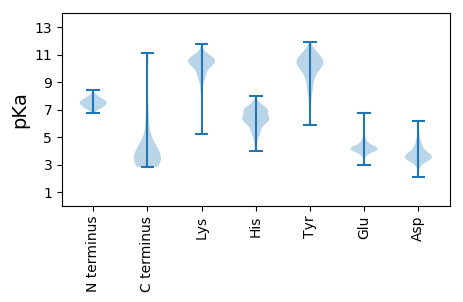
Isoelectric point according different methods:
Protein with the highest isoelectric point:
>sp|Q3V4V9|Y059B_ATV Uncharacterized protein ORF59b OS=Acidianus two-tailed virus OX=315953 PE=4 SV=1
MM1 pKa = 7.45KK2 pKa = 10.35VLSFLIRR9 pKa = 11.84QDD11 pKa = 3.13HH12 pKa = 6.7LLYY15 pKa = 10.82LDD17 pKa = 4.81IFAKK21 pKa = 10.39QNNLTRR27 pKa = 11.84SDD29 pKa = 4.17AIRR32 pKa = 11.84YY33 pKa = 7.73AISVLDD39 pKa = 4.01EE40 pKa = 4.2EE41 pKa = 4.77STPVSLVGFPGIKK54 pKa = 9.77LVRR57 pKa = 11.84TSVKK61 pKa = 10.06LAEE64 pKa = 4.24NVISRR69 pKa = 11.84IDD71 pKa = 3.28RR72 pKa = 11.84LAILSKK78 pKa = 9.49ITRR81 pKa = 11.84SDD83 pKa = 3.56VIRR86 pKa = 11.84NAIYY90 pKa = 10.45HH91 pKa = 6.35LLINNAPKK99 pKa = 10.16QLPPVTAQTEE109 pKa = 4.14KK110 pKa = 10.64KK111 pKa = 9.56YY112 pKa = 10.98GYY114 pKa = 9.03VCPYY118 pKa = 9.15CVSRR122 pKa = 11.84FPTVRR127 pKa = 11.84ALKK130 pKa = 8.94IHH132 pKa = 6.98LKK134 pKa = 9.86RR135 pKa = 11.84RR136 pKa = 11.84HH137 pKa = 6.39NGFPWCPVCYY147 pKa = 10.14KK148 pKa = 10.29PLKK151 pKa = 10.0NKK153 pKa = 9.98NATNHH158 pKa = 5.26FRR160 pKa = 11.84RR161 pKa = 11.84FTDD164 pKa = 3.62PQHH167 pKa = 5.95QFWYY171 pKa = 8.34MISRR175 pKa = 11.84KK176 pKa = 9.46RR177 pKa = 11.84YY178 pKa = 8.01LSSHH182 pKa = 6.05RR183 pKa = 11.84KK184 pKa = 8.47EE185 pKa = 4.12AVKK188 pKa = 10.47QQ189 pKa = 3.48
MM1 pKa = 7.45KK2 pKa = 10.35VLSFLIRR9 pKa = 11.84QDD11 pKa = 3.13HH12 pKa = 6.7LLYY15 pKa = 10.82LDD17 pKa = 4.81IFAKK21 pKa = 10.39QNNLTRR27 pKa = 11.84SDD29 pKa = 4.17AIRR32 pKa = 11.84YY33 pKa = 7.73AISVLDD39 pKa = 4.01EE40 pKa = 4.2EE41 pKa = 4.77STPVSLVGFPGIKK54 pKa = 9.77LVRR57 pKa = 11.84TSVKK61 pKa = 10.06LAEE64 pKa = 4.24NVISRR69 pKa = 11.84IDD71 pKa = 3.28RR72 pKa = 11.84LAILSKK78 pKa = 9.49ITRR81 pKa = 11.84SDD83 pKa = 3.56VIRR86 pKa = 11.84NAIYY90 pKa = 10.45HH91 pKa = 6.35LLINNAPKK99 pKa = 10.16QLPPVTAQTEE109 pKa = 4.14KK110 pKa = 10.64KK111 pKa = 9.56YY112 pKa = 10.98GYY114 pKa = 9.03VCPYY118 pKa = 9.15CVSRR122 pKa = 11.84FPTVRR127 pKa = 11.84ALKK130 pKa = 8.94IHH132 pKa = 6.98LKK134 pKa = 9.86RR135 pKa = 11.84RR136 pKa = 11.84HH137 pKa = 6.39NGFPWCPVCYY147 pKa = 10.14KK148 pKa = 10.29PLKK151 pKa = 10.0NKK153 pKa = 9.98NATNHH158 pKa = 5.26FRR160 pKa = 11.84RR161 pKa = 11.84FTDD164 pKa = 3.62PQHH167 pKa = 5.95QFWYY171 pKa = 8.34MISRR175 pKa = 11.84KK176 pKa = 9.46RR177 pKa = 11.84YY178 pKa = 8.01LSSHH182 pKa = 6.05RR183 pKa = 11.84KK184 pKa = 8.47EE185 pKa = 4.12AVKK188 pKa = 10.47QQ189 pKa = 3.48
Molecular weight: 22.11 kDa
Isoelectric point according different methods:
Peptides (in silico digests for buttom-up proteomics)
Below you can find in silico digests of the whole proteome with Trypsin, Chymotrypsin, Trypsin+LysC, LysN, ArgC proteases suitable for different mass spec machines.| Try ESI |
 |
|---|
| ChTry ESI |
 |
|---|
| ArgC ESI |
 |
|---|
| LysN ESI |
 |
|---|
| TryLysC ESI |
 |
|---|
| Try MALDI |
 |
|---|
| ChTry MALDI |
 |
|---|
| ArgC MALDI |
 |
|---|
| LysN MALDI |
 |
|---|
| TryLysC MALDI |
 |
|---|
| Try LTQ |
 |
|---|
| ChTry LTQ |
 |
|---|
| ArgC LTQ |
 |
|---|
| LysN LTQ |
 |
|---|
| TryLysC LTQ |
 |
|---|
| Try MSlow |
 |
|---|
| ChTry MSlow |
 |
|---|
| ArgC MSlow |
 |
|---|
| LysN MSlow |
 |
|---|
| TryLysC MSlow |
 |
|---|
| Try MShigh |
 |
|---|
| ChTry MShigh |
 |
|---|
| ArgC MShigh |
 |
|---|
| LysN MShigh |
 |
|---|
| TryLysC MShigh |
 |
|---|
General Statistics
Number of major isoforms |
Number of additional isoforms |
Number of all proteins |
Number of amino acids |
Min. Seq. Length |
Max. Seq. Length |
Avg. Seq. Length |
Avg. Mol. Weight |
|---|---|---|---|---|---|---|---|
0 |
19264 |
34 |
1940 |
267.6 |
30.31 |
Amino acid frequency
Ala |
Cys |
Asp |
Glu |
Phe |
Gly |
His |
Ile |
Lys |
Leu |
|---|---|---|---|---|---|---|---|---|---|
5.975 ± 0.317 | 0.54 ± 0.087 |
4.532 ± 0.423 | 7.283 ± 0.751 |
4.36 ± 0.317 | 5.248 ± 0.412 |
1.355 ± 0.244 | 7.413 ± 0.291 |
7.807 ± 0.653 | 9.619 ± 0.437 |
Met |
Asn |
Gln |
Pro |
Arg |
Ser |
Thr |
Val |
Trp |
Tyr |
|---|---|---|---|---|---|---|---|---|---|
2.139 ± 0.17 | 5.347 ± 0.309 |
5.253 ± 0.546 | 4.033 ± 0.328 |
3.774 ± 0.446 | 6.868 ± 0.556 |
6.099 ± 0.575 | 6.759 ± 0.38 |
0.877 ± 0.127 | 4.719 ± 0.403 |
Most of the basic statistics you can see at this page can be downloaded from this CSV file
Proteome-pI is available under Creative Commons Attribution-NoDerivs license, for more details see here
| Reference: Kozlowski LP. Proteome-pI 2.0: Proteome Isoelectric Point Database Update. Nucleic Acids Res. 2021, doi: 10.1093/nar/gkab944 | Contact: Lukasz P. Kozlowski |
