Simian immunodeficiency virus (isolate MB66) (SIV-cpz) (Chimpanzee immunodeficiency virus)
Taxonomy: Viruses; Riboviria; Pararnavirae; Artverviricota; Revtraviricetes; Ortervirales; Retroviridae; Orthoretrovirinae; Lentivirus; Simian immunodeficiency virus; Simian immunodeficiency virus - cpz
Average proteome isoelectric point is 7.55
Get precalculated fractions of proteins

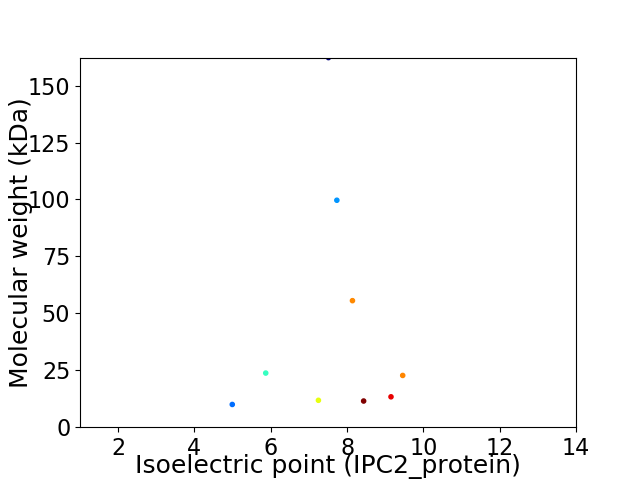
Virtual 2D-PAGE plot for 9 proteins (isoelectric point calculated using IPC2_protein)
Get csv file with sequences according to given criteria:
* You can choose from 21 different methods for calculating isoelectric point
Summary statistics related to proteome-wise predictions


Protein with the lowest isoelectric point:
>sp|Q1A263|REV_SIVMB Protein Rev OS=Simian immunodeficiency virus (isolate MB66) OX=388911 GN=rev PE=3 SV=1
MM1 pKa = 8.23DD2 pKa = 4.26IVQQVGLLVVLIIEE16 pKa = 4.16LVIVIVIWVKK26 pKa = 10.28VYY28 pKa = 10.6KK29 pKa = 10.35LCKK32 pKa = 8.96EE33 pKa = 4.07DD34 pKa = 4.15RR35 pKa = 11.84RR36 pKa = 11.84QKK38 pKa = 10.91KK39 pKa = 9.05IDD41 pKa = 3.48RR42 pKa = 11.84LIARR46 pKa = 11.84IRR48 pKa = 11.84EE49 pKa = 3.94RR50 pKa = 11.84AEE52 pKa = 4.05DD53 pKa = 3.71SGNEE57 pKa = 3.97SDD59 pKa = 5.61GDD61 pKa = 3.95TEE63 pKa = 4.15EE64 pKa = 4.43LQDD67 pKa = 6.34LITEE71 pKa = 5.2GDD73 pKa = 3.6NLMHH77 pKa = 7.27IGIRR81 pKa = 11.84DD82 pKa = 3.43NRR84 pKa = 11.84NNN86 pKa = 3.32
MM1 pKa = 8.23DD2 pKa = 4.26IVQQVGLLVVLIIEE16 pKa = 4.16LVIVIVIWVKK26 pKa = 10.28VYY28 pKa = 10.6KK29 pKa = 10.35LCKK32 pKa = 8.96EE33 pKa = 4.07DD34 pKa = 4.15RR35 pKa = 11.84RR36 pKa = 11.84QKK38 pKa = 10.91KK39 pKa = 9.05IDD41 pKa = 3.48RR42 pKa = 11.84LIARR46 pKa = 11.84IRR48 pKa = 11.84EE49 pKa = 3.94RR50 pKa = 11.84AEE52 pKa = 4.05DD53 pKa = 3.71SGNEE57 pKa = 3.97SDD59 pKa = 5.61GDD61 pKa = 3.95TEE63 pKa = 4.15EE64 pKa = 4.43LQDD67 pKa = 6.34LITEE71 pKa = 5.2GDD73 pKa = 3.6NLMHH77 pKa = 7.27IGIRR81 pKa = 11.84DD82 pKa = 3.43NRR84 pKa = 11.84NNN86 pKa = 3.32
Molecular weight: 9.98 kDa
Isoelectric point according different methods:
Protein with the highest isoelectric point:
>sp|Q1A264|TAT_SIVMB Protein Tat OS=Simian immunodeficiency virus (isolate MB66) OX=388911 GN=tat PE=3 SV=1
MM1 pKa = 7.75AGGSGNSDD9 pKa = 3.59EE10 pKa = 4.42EE11 pKa = 4.07LLRR14 pKa = 11.84AVRR17 pKa = 11.84IIKK20 pKa = 9.77ILYY23 pKa = 8.77QSNPYY28 pKa = 9.44PSPEE32 pKa = 3.82GSRR35 pKa = 11.84QARR38 pKa = 11.84RR39 pKa = 11.84NRR41 pKa = 11.84RR42 pKa = 11.84RR43 pKa = 11.84RR44 pKa = 11.84WRR46 pKa = 11.84ARR48 pKa = 11.84QRR50 pKa = 11.84QINSLSEE57 pKa = 4.76RR58 pKa = 11.84ILSTCLEE65 pKa = 4.45RR66 pKa = 11.84PTGPVSLPLPPIEE79 pKa = 5.58RR80 pKa = 11.84LTLDD84 pKa = 3.18SAEE87 pKa = 4.96DD88 pKa = 3.32IGTGGTDD95 pKa = 3.36PPQGTEE101 pKa = 3.85TGTGSPNTPEE111 pKa = 3.8GHH113 pKa = 5.28STILGTGAKK122 pKa = 9.41NN123 pKa = 3.1
MM1 pKa = 7.75AGGSGNSDD9 pKa = 3.59EE10 pKa = 4.42EE11 pKa = 4.07LLRR14 pKa = 11.84AVRR17 pKa = 11.84IIKK20 pKa = 9.77ILYY23 pKa = 8.77QSNPYY28 pKa = 9.44PSPEE32 pKa = 3.82GSRR35 pKa = 11.84QARR38 pKa = 11.84RR39 pKa = 11.84NRR41 pKa = 11.84RR42 pKa = 11.84RR43 pKa = 11.84RR44 pKa = 11.84WRR46 pKa = 11.84ARR48 pKa = 11.84QRR50 pKa = 11.84QINSLSEE57 pKa = 4.76RR58 pKa = 11.84ILSTCLEE65 pKa = 4.45RR66 pKa = 11.84PTGPVSLPLPPIEE79 pKa = 5.58RR80 pKa = 11.84LTLDD84 pKa = 3.18SAEE87 pKa = 4.96DD88 pKa = 3.32IGTGGTDD95 pKa = 3.36PPQGTEE101 pKa = 3.85TGTGSPNTPEE111 pKa = 3.8GHH113 pKa = 5.28STILGTGAKK122 pKa = 9.41NN123 pKa = 3.1
Molecular weight: 13.34 kDa
Isoelectric point according different methods:
Peptides (in silico digests for buttom-up proteomics)
Below you can find in silico digests of the whole proteome with Trypsin, Chymotrypsin, Trypsin+LysC, LysN, ArgC proteases suitable for different mass spec machines.| Try ESI |
 |
|---|
| ChTry ESI |
 |
|---|
| ArgC ESI |
 |
|---|
| LysN ESI |
 |
|---|
| TryLysC ESI |
 |
|---|
| Try MALDI |
 |
|---|
| ChTry MALDI |
 |
|---|
| ArgC MALDI |
 |
|---|
| LysN MALDI |
 |
|---|
| TryLysC MALDI |
 |
|---|
| Try LTQ |
 |
|---|
| ChTry LTQ |
 |
|---|
| ArgC LTQ |
 |
|---|
| LysN LTQ |
 |
|---|
| TryLysC LTQ |
 |
|---|
| Try MSlow |
 |
|---|
| ChTry MSlow |
 |
|---|
| ArgC MSlow |
 |
|---|
| LysN MSlow |
 |
|---|
| TryLysC MSlow |
 |
|---|
| Try MShigh |
 |
|---|
| ChTry MShigh |
 |
|---|
| ArgC MShigh |
 |
|---|
| LysN MShigh |
 |
|---|
| TryLysC MShigh |
 |
|---|
General Statistics
Number of major isoforms |
Number of additional isoforms |
Number of all proteins |
Number of amino acids |
Min. Seq. Length |
Max. Seq. Length |
Avg. Seq. Length |
Avg. Mol. Weight |
|---|---|---|---|---|---|---|---|
0 |
3623 |
86 |
1438 |
402.6 |
45.63 |
Amino acid frequency
Ala |
Cys |
Asp |
Glu |
Phe |
Gly |
His |
Ile |
Lys |
Leu |
|---|---|---|---|---|---|---|---|---|---|
5.934 ± 0.555 | 2.098 ± 0.362 |
4.03 ± 0.196 | 7.287 ± 0.562 |
2.705 ± 0.3 | 7.452 ± 0.334 |
2.125 ± 0.421 | 6.707 ± 0.745 |
6.542 ± 0.843 | 8.556 ± 0.94 |
Met |
Asn |
Gln |
Pro |
Arg |
Ser |
Thr |
Val |
Trp |
Tyr |
|---|---|---|---|---|---|---|---|---|---|
1.96 ± 0.227 | 4.913 ± 0.648 |
5.244 ± 0.763 | 6.017 ± 0.547 |
6.238 ± 0.754 | 4.83 ± 0.508 |
6.183 ± 0.61 | 6.128 ± 0.485 |
2.484 ± 0.219 | 2.567 ± 0.275 |
Most of the basic statistics you can see at this page can be downloaded from this CSV file
Proteome-pI is available under Creative Commons Attribution-NoDerivs license, for more details see here
| Reference: Kozlowski LP. Proteome-pI 2.0: Proteome Isoelectric Point Database Update. Nucleic Acids Res. 2021, doi: 10.1093/nar/gkab944 | Contact: Lukasz P. Kozlowski |
