Fusarium sporotrichioides
Taxonomy: cellular organisms; Eukaryota; Opisthokonta; Fungi; Dikarya; Ascomycota; saccharomyceta; Pezizomycotina; leotiomyceta; sordariomyceta; Sordariomycetes; Hypocreomycetidae; Hypocreales; Nectriaceae; Fusarium; Fusarium sambucinum species complex
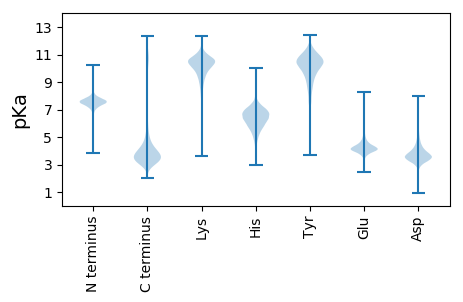
Average proteome isoelectric point is 6.25
Get precalculated fractions of proteins

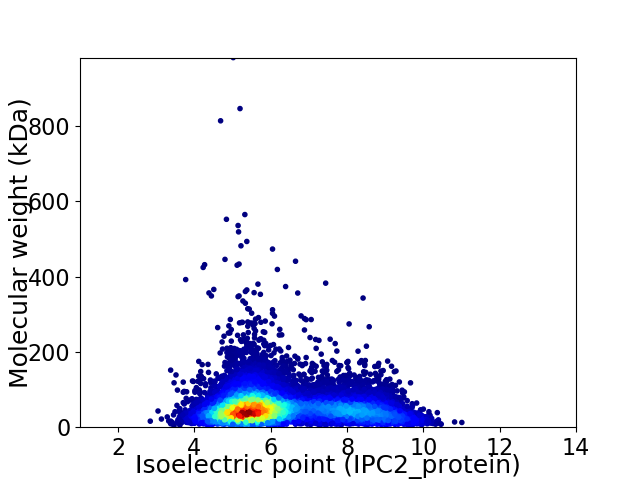
Virtual 2D-PAGE plot for 11960 proteins (isoelectric point calculated using IPC2_protein)
Get csv file with sequences according to given criteria:
* You can choose from 21 different methods for calculating isoelectric point
Summary statistics related to proteome-wise predictions


Protein with the lowest isoelectric point:
>tr|A0A395RVZ6|A0A395RVZ6_FUSSP Necrosis inducing-domain-containing OS=Fusarium sporotrichioides OX=5514 GN=FSPOR_8307 PE=3 SV=1
MM1 pKa = 7.51GAQISVVTSNDD12 pKa = 2.83ATEE15 pKa = 3.92VANAIFNGPGVSVVGATLEE34 pKa = 3.98RR35 pKa = 11.84NYY37 pKa = 10.29WEE39 pKa = 4.65EE40 pKa = 3.79DD41 pKa = 3.43TLNGNRR47 pKa = 11.84GSVGTFTRR55 pKa = 11.84GPFGIGSGGILSSGWSRR72 pKa = 11.84DD73 pKa = 3.58AKK75 pKa = 10.86DD76 pKa = 3.59SSATGNRR83 pKa = 11.84DD84 pKa = 3.03TGVDD88 pKa = 3.38GSLYY92 pKa = 10.14CGPGSTTNGAVLSVDD107 pKa = 3.01ILVDD111 pKa = 3.24TGYY114 pKa = 11.17NGLSVEE120 pKa = 4.54FVLATDD126 pKa = 4.36EE127 pKa = 4.08NLQGNADD134 pKa = 3.57PMGIYY139 pKa = 10.31LDD141 pKa = 4.11DD142 pKa = 3.44VQYY145 pKa = 11.88ALDD148 pKa = 3.63TSGNRR153 pKa = 11.84ITVNSDD159 pKa = 3.08YY160 pKa = 10.6LQQPIGITDD169 pKa = 3.72NQLLSATMYY178 pKa = 11.19GNASPLLIMGLAASPGQHH196 pKa = 5.47RR197 pKa = 11.84MIFAICDD204 pKa = 3.51ANNGEE209 pKa = 4.44KK210 pKa = 10.59DD211 pKa = 3.32SALMVKK217 pKa = 10.49AGACVDD223 pKa = 3.71CVRR226 pKa = 11.84DD227 pKa = 3.49IKK229 pKa = 11.18LNYY232 pKa = 8.01ATTTTTVGPTPFVSTIKK249 pKa = 10.62AALTMSGTVVYY260 pKa = 9.11GVPEE264 pKa = 4.13PATTEE269 pKa = 3.95VTTTTEE275 pKa = 3.84EE276 pKa = 4.46AYY278 pKa = 9.37STTTADD284 pKa = 3.03ATSYY288 pKa = 10.63TEE290 pKa = 4.15EE291 pKa = 4.24TTSTTEE297 pKa = 3.76LMSMSEE303 pKa = 4.21EE304 pKa = 4.21STPTEE309 pKa = 3.84PTATADD315 pKa = 3.61VLSTSTEE322 pKa = 3.59ASTAAEE328 pKa = 4.14APTTNDD334 pKa = 2.92LPTTTGVSSEE344 pKa = 4.36EE345 pKa = 3.91LTSTDD350 pKa = 3.57EE351 pKa = 4.33SSTTADD357 pKa = 3.42YY358 pKa = 7.52TTTATTTTTYY368 pKa = 10.82NQGSEE373 pKa = 4.13TSSAEE378 pKa = 4.14EE379 pKa = 4.26PDD381 pKa = 3.56TTTTIATSEE390 pKa = 4.16TMTNSMDD397 pKa = 3.37VSEE400 pKa = 5.12SSVSTSMDD408 pKa = 3.03STLSNDD414 pKa = 3.33SALITAAATTTSTSQASMSTASTLTTIRR442 pKa = 11.84RR443 pKa = 11.84PCRR446 pKa = 11.84PP447 pKa = 3.24
MM1 pKa = 7.51GAQISVVTSNDD12 pKa = 2.83ATEE15 pKa = 3.92VANAIFNGPGVSVVGATLEE34 pKa = 3.98RR35 pKa = 11.84NYY37 pKa = 10.29WEE39 pKa = 4.65EE40 pKa = 3.79DD41 pKa = 3.43TLNGNRR47 pKa = 11.84GSVGTFTRR55 pKa = 11.84GPFGIGSGGILSSGWSRR72 pKa = 11.84DD73 pKa = 3.58AKK75 pKa = 10.86DD76 pKa = 3.59SSATGNRR83 pKa = 11.84DD84 pKa = 3.03TGVDD88 pKa = 3.38GSLYY92 pKa = 10.14CGPGSTTNGAVLSVDD107 pKa = 3.01ILVDD111 pKa = 3.24TGYY114 pKa = 11.17NGLSVEE120 pKa = 4.54FVLATDD126 pKa = 4.36EE127 pKa = 4.08NLQGNADD134 pKa = 3.57PMGIYY139 pKa = 10.31LDD141 pKa = 4.11DD142 pKa = 3.44VQYY145 pKa = 11.88ALDD148 pKa = 3.63TSGNRR153 pKa = 11.84ITVNSDD159 pKa = 3.08YY160 pKa = 10.6LQQPIGITDD169 pKa = 3.72NQLLSATMYY178 pKa = 11.19GNASPLLIMGLAASPGQHH196 pKa = 5.47RR197 pKa = 11.84MIFAICDD204 pKa = 3.51ANNGEE209 pKa = 4.44KK210 pKa = 10.59DD211 pKa = 3.32SALMVKK217 pKa = 10.49AGACVDD223 pKa = 3.71CVRR226 pKa = 11.84DD227 pKa = 3.49IKK229 pKa = 11.18LNYY232 pKa = 8.01ATTTTTVGPTPFVSTIKK249 pKa = 10.62AALTMSGTVVYY260 pKa = 9.11GVPEE264 pKa = 4.13PATTEE269 pKa = 3.95VTTTTEE275 pKa = 3.84EE276 pKa = 4.46AYY278 pKa = 9.37STTTADD284 pKa = 3.03ATSYY288 pKa = 10.63TEE290 pKa = 4.15EE291 pKa = 4.24TTSTTEE297 pKa = 3.76LMSMSEE303 pKa = 4.21EE304 pKa = 4.21STPTEE309 pKa = 3.84PTATADD315 pKa = 3.61VLSTSTEE322 pKa = 3.59ASTAAEE328 pKa = 4.14APTTNDD334 pKa = 2.92LPTTTGVSSEE344 pKa = 4.36EE345 pKa = 3.91LTSTDD350 pKa = 3.57EE351 pKa = 4.33SSTTADD357 pKa = 3.42YY358 pKa = 7.52TTTATTTTTYY368 pKa = 10.82NQGSEE373 pKa = 4.13TSSAEE378 pKa = 4.14EE379 pKa = 4.26PDD381 pKa = 3.56TTTTIATSEE390 pKa = 4.16TMTNSMDD397 pKa = 3.37VSEE400 pKa = 5.12SSVSTSMDD408 pKa = 3.03STLSNDD414 pKa = 3.33SALITAAATTTSTSQASMSTASTLTTIRR442 pKa = 11.84RR443 pKa = 11.84PCRR446 pKa = 11.84PP447 pKa = 3.24
Molecular weight: 46.13 kDa
Isoelectric point according different methods:
Protein with the highest isoelectric point:
>tr|A0A395SPL0|A0A395SPL0_FUSSP S-adenosyl-L-methionine-dependent N-methyltransferase OS=Fusarium sporotrichioides OX=5514 GN=FSPOR_1714 PE=4 SV=1
MM1 pKa = 7.86PLTRR5 pKa = 11.84THH7 pKa = 6.18RR8 pKa = 11.84HH9 pKa = 4.47AAPRR13 pKa = 11.84RR14 pKa = 11.84SIFSTRR20 pKa = 11.84RR21 pKa = 11.84RR22 pKa = 11.84APARR26 pKa = 11.84SNRR29 pKa = 11.84HH30 pKa = 4.32TVTTTTTTSKK40 pKa = 10.17PRR42 pKa = 11.84RR43 pKa = 11.84GMFGGGSTTRR53 pKa = 11.84RR54 pKa = 11.84THH56 pKa = 4.8GTTPVHH62 pKa = 5.36HH63 pKa = 6.39HH64 pKa = 5.26QRR66 pKa = 11.84RR67 pKa = 11.84PSMKK71 pKa = 10.02DD72 pKa = 2.95KK73 pKa = 11.41VSGALLKK80 pKa = 11.04LKK82 pKa = 10.68GSLTRR87 pKa = 11.84RR88 pKa = 11.84PGVKK92 pKa = 9.89AAGTRR97 pKa = 11.84RR98 pKa = 11.84MHH100 pKa = 5.65GTDD103 pKa = 2.99GRR105 pKa = 11.84GARR108 pKa = 11.84HH109 pKa = 5.87HH110 pKa = 7.23RR111 pKa = 11.84YY112 pKa = 9.44
MM1 pKa = 7.86PLTRR5 pKa = 11.84THH7 pKa = 6.18RR8 pKa = 11.84HH9 pKa = 4.47AAPRR13 pKa = 11.84RR14 pKa = 11.84SIFSTRR20 pKa = 11.84RR21 pKa = 11.84RR22 pKa = 11.84APARR26 pKa = 11.84SNRR29 pKa = 11.84HH30 pKa = 4.32TVTTTTTTSKK40 pKa = 10.17PRR42 pKa = 11.84RR43 pKa = 11.84GMFGGGSTTRR53 pKa = 11.84RR54 pKa = 11.84THH56 pKa = 4.8GTTPVHH62 pKa = 5.36HH63 pKa = 6.39HH64 pKa = 5.26QRR66 pKa = 11.84RR67 pKa = 11.84PSMKK71 pKa = 10.02DD72 pKa = 2.95KK73 pKa = 11.41VSGALLKK80 pKa = 11.04LKK82 pKa = 10.68GSLTRR87 pKa = 11.84RR88 pKa = 11.84PGVKK92 pKa = 9.89AAGTRR97 pKa = 11.84RR98 pKa = 11.84MHH100 pKa = 5.65GTDD103 pKa = 2.99GRR105 pKa = 11.84GARR108 pKa = 11.84HH109 pKa = 5.87HH110 pKa = 7.23RR111 pKa = 11.84YY112 pKa = 9.44
Molecular weight: 12.57 kDa
Isoelectric point according different methods:
Peptides (in silico digests for buttom-up proteomics)
Below you can find in silico digests of the whole proteome with Trypsin, Chymotrypsin, Trypsin+LysC, LysN, ArgC proteases suitable for different mass spec machines.| Try ESI |
 |
|---|
| ChTry ESI |
 |
|---|
| ArgC ESI |
 |
|---|
| LysN ESI |
 |
|---|
| TryLysC ESI |
 |
|---|
| Try MALDI |
 |
|---|
| ChTry MALDI |
 |
|---|
| ArgC MALDI |
 |
|---|
| LysN MALDI |
 |
|---|
| TryLysC MALDI |
 |
|---|
| Try LTQ |
 |
|---|
| ChTry LTQ |
 |
|---|
| ArgC LTQ |
 |
|---|
| LysN LTQ |
 |
|---|
| TryLysC LTQ |
 |
|---|
| Try MSlow |
 |
|---|
| ChTry MSlow |
 |
|---|
| ArgC MSlow |
 |
|---|
| LysN MSlow |
 |
|---|
| TryLysC MSlow |
 |
|---|
| Try MShigh |
 |
|---|
| ChTry MShigh |
 |
|---|
| ArgC MShigh |
 |
|---|
| LysN MShigh |
 |
|---|
| TryLysC MShigh |
 |
|---|
General Statistics
Number of major isoforms |
Number of additional isoforms |
Number of all proteins |
Number of amino acids |
Min. Seq. Length |
Max. Seq. Length |
Avg. Seq. Length |
Avg. Mol. Weight |
|---|---|---|---|---|---|---|---|
0 |
6079613 |
42 |
8933 |
508.3 |
56.34 |
Amino acid frequency
Ala |
Cys |
Asp |
Glu |
Phe |
Gly |
His |
Ile |
Lys |
Leu |
|---|---|---|---|---|---|---|---|---|---|
8.327 ± 0.021 | 1.245 ± 0.009 |
5.94 ± 0.019 | 6.265 ± 0.026 |
3.773 ± 0.015 | 6.789 ± 0.022 |
2.335 ± 0.009 | 5.088 ± 0.017 |
5.091 ± 0.02 | 8.656 ± 0.025 |
Met |
Asn |
Gln |
Pro |
Arg |
Ser |
Thr |
Val |
Trp |
Tyr |
|---|---|---|---|---|---|---|---|---|---|
2.24 ± 0.008 | 3.858 ± 0.011 |
5.922 ± 0.024 | 4.033 ± 0.018 |
5.754 ± 0.02 | 8.129 ± 0.022 |
6.092 ± 0.026 | 6.148 ± 0.018 |
1.511 ± 0.009 | 2.803 ± 0.012 |
Most of the basic statistics you can see at this page can be downloaded from this CSV file
Proteome-pI is available under Creative Commons Attribution-NoDerivs license, for more details see here
| Reference: Kozlowski LP. Proteome-pI 2.0: Proteome Isoelectric Point Database Update. Nucleic Acids Res. 2021, doi: 10.1093/nar/gkab944 | Contact: Lukasz P. Kozlowski |
