Cetobacterium ceti
Taxonomy: cellular organisms; Bacteria; Fusobacteria; Fusobacteriia; Fusobacteriales; Fusobacteriaceae; Cetobacterium
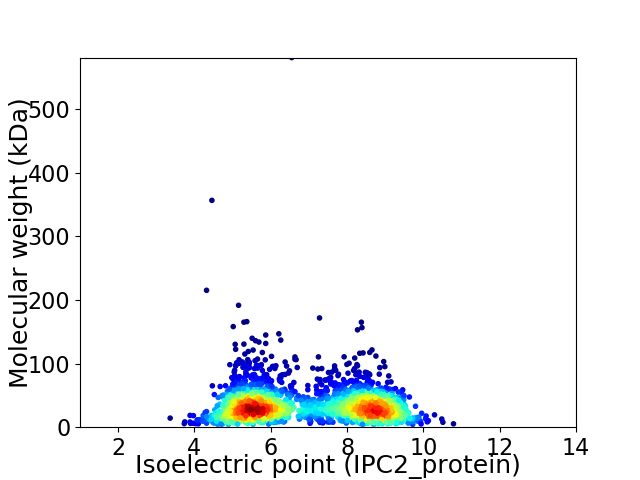
Average proteome isoelectric point is 6.91
Get precalculated fractions of proteins

Virtual 2D-PAGE plot for 2511 proteins (isoelectric point calculated using IPC2_protein)
Get csv file with sequences according to given criteria:
* You can choose from 21 different methods for calculating isoelectric point
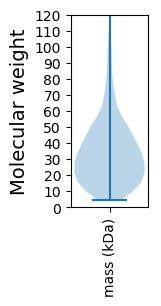
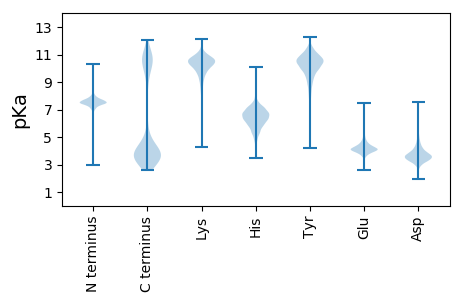
Summary statistics related to proteome-wise predictions


Protein with the lowest isoelectric point:
>tr|A0A1T4PPN8|A0A1T4PPN8_9FUSO RNA polymerase sigma factor SigS OS=Cetobacterium ceti OX=180163 GN=SAMN02745174_01999 PE=3 SV=1
MM1 pKa = 7.43EE2 pKa = 4.81KK3 pKa = 9.21WRR5 pKa = 11.84CVICDD10 pKa = 3.51YY11 pKa = 11.35VYY13 pKa = 10.82DD14 pKa = 4.21PEE16 pKa = 5.27VGDD19 pKa = 3.88VDD21 pKa = 4.84SGIAPGTKK29 pKa = 9.9FEE31 pKa = 6.11DD32 pKa = 4.08IPDD35 pKa = 3.67DD36 pKa = 4.06WVCPICSVGKK46 pKa = 9.96DD47 pKa = 3.3QFEE50 pKa = 4.47KK51 pKa = 10.33MDD53 pKa = 3.42
MM1 pKa = 7.43EE2 pKa = 4.81KK3 pKa = 9.21WRR5 pKa = 11.84CVICDD10 pKa = 3.51YY11 pKa = 11.35VYY13 pKa = 10.82DD14 pKa = 4.21PEE16 pKa = 5.27VGDD19 pKa = 3.88VDD21 pKa = 4.84SGIAPGTKK29 pKa = 9.9FEE31 pKa = 6.11DD32 pKa = 4.08IPDD35 pKa = 3.67DD36 pKa = 4.06WVCPICSVGKK46 pKa = 9.96DD47 pKa = 3.3QFEE50 pKa = 4.47KK51 pKa = 10.33MDD53 pKa = 3.42
Molecular weight: 6.05 kDa
Isoelectric point according different methods:
Protein with the highest isoelectric point:
>tr|A0A1T4KJI6|A0A1T4KJI6_9FUSO Uncharacterized membrane protein OS=Cetobacterium ceti OX=180163 GN=SAMN02745174_00453 PE=4 SV=1
MM1 pKa = 7.33KK2 pKa = 10.04KK3 pKa = 10.29YY4 pKa = 10.45RR5 pKa = 11.84GVLVALILCLFTGCGATIRR24 pKa = 11.84MSNKK28 pKa = 9.53KK29 pKa = 9.0ISRR32 pKa = 11.84YY33 pKa = 6.67FTARR37 pKa = 11.84EE38 pKa = 3.77ALYY41 pKa = 10.6SATAKK46 pKa = 10.05RR47 pKa = 11.84YY48 pKa = 9.38NMSNIPLSKK57 pKa = 10.16ATDD60 pKa = 3.86NIYY63 pKa = 9.77YY64 pKa = 9.3CAWRR68 pKa = 11.84MDD70 pKa = 3.13KK71 pKa = 10.55VRR73 pKa = 11.84RR74 pKa = 11.84FLGTPIHH81 pKa = 6.12VNSWYY86 pKa = 10.3RR87 pKa = 11.84SPRR90 pKa = 11.84VNRR93 pKa = 11.84KK94 pKa = 9.28VGGVSHH100 pKa = 7.03SYY102 pKa = 10.0HH103 pKa = 5.29VQGLAVDD110 pKa = 5.85FYY112 pKa = 10.47TKK114 pKa = 10.66KK115 pKa = 10.24NPKK118 pKa = 9.16YY119 pKa = 10.39VYY121 pKa = 10.14NKK123 pKa = 9.72LRR125 pKa = 11.84RR126 pKa = 11.84SRR128 pKa = 11.84LSFDD132 pKa = 3.02QLIYY136 pKa = 10.77YY137 pKa = 7.98PRR139 pKa = 11.84QKK141 pKa = 10.24RR142 pKa = 11.84FHH144 pKa = 6.37ISFRR148 pKa = 11.84RR149 pKa = 11.84NIRR152 pKa = 11.84QEE154 pKa = 3.41RR155 pKa = 11.84RR156 pKa = 11.84QAFVKK161 pKa = 10.54YY162 pKa = 10.41
MM1 pKa = 7.33KK2 pKa = 10.04KK3 pKa = 10.29YY4 pKa = 10.45RR5 pKa = 11.84GVLVALILCLFTGCGATIRR24 pKa = 11.84MSNKK28 pKa = 9.53KK29 pKa = 9.0ISRR32 pKa = 11.84YY33 pKa = 6.67FTARR37 pKa = 11.84EE38 pKa = 3.77ALYY41 pKa = 10.6SATAKK46 pKa = 10.05RR47 pKa = 11.84YY48 pKa = 9.38NMSNIPLSKK57 pKa = 10.16ATDD60 pKa = 3.86NIYY63 pKa = 9.77YY64 pKa = 9.3CAWRR68 pKa = 11.84MDD70 pKa = 3.13KK71 pKa = 10.55VRR73 pKa = 11.84RR74 pKa = 11.84FLGTPIHH81 pKa = 6.12VNSWYY86 pKa = 10.3RR87 pKa = 11.84SPRR90 pKa = 11.84VNRR93 pKa = 11.84KK94 pKa = 9.28VGGVSHH100 pKa = 7.03SYY102 pKa = 10.0HH103 pKa = 5.29VQGLAVDD110 pKa = 5.85FYY112 pKa = 10.47TKK114 pKa = 10.66KK115 pKa = 10.24NPKK118 pKa = 9.16YY119 pKa = 10.39VYY121 pKa = 10.14NKK123 pKa = 9.72LRR125 pKa = 11.84RR126 pKa = 11.84SRR128 pKa = 11.84LSFDD132 pKa = 3.02QLIYY136 pKa = 10.77YY137 pKa = 7.98PRR139 pKa = 11.84QKK141 pKa = 10.24RR142 pKa = 11.84FHH144 pKa = 6.37ISFRR148 pKa = 11.84RR149 pKa = 11.84NIRR152 pKa = 11.84QEE154 pKa = 3.41RR155 pKa = 11.84RR156 pKa = 11.84QAFVKK161 pKa = 10.54YY162 pKa = 10.41
Molecular weight: 19.4 kDa
Isoelectric point according different methods:
Peptides (in silico digests for buttom-up proteomics)
Below you can find in silico digests of the whole proteome with Trypsin, Chymotrypsin, Trypsin+LysC, LysN, ArgC proteases suitable for different mass spec machines.| Try ESI |
 |
|---|
| ChTry ESI |
 |
|---|
| ArgC ESI |
 |
|---|
| LysN ESI |
 |
|---|
| TryLysC ESI |
 |
|---|
| Try MALDI |
 |
|---|
| ChTry MALDI |
 |
|---|
| ArgC MALDI |
 |
|---|
| LysN MALDI |
 |
|---|
| TryLysC MALDI |
 |
|---|
| Try LTQ |
 |
|---|
| ChTry LTQ |
 |
|---|
| ArgC LTQ |
 |
|---|
| LysN LTQ |
 |
|---|
| TryLysC LTQ |
 |
|---|
| Try MSlow |
 |
|---|
| ChTry MSlow |
 |
|---|
| ArgC MSlow |
 |
|---|
| LysN MSlow |
 |
|---|
| TryLysC MSlow |
 |
|---|
| Try MShigh |
 |
|---|
| ChTry MShigh |
 |
|---|
| ArgC MShigh |
 |
|---|
| LysN MShigh |
 |
|---|
| TryLysC MShigh |
 |
|---|
General Statistics
Number of major isoforms |
Number of additional isoforms |
Number of all proteins |
Number of amino acids |
Min. Seq. Length |
Max. Seq. Length |
Avg. Seq. Length |
Avg. Mol. Weight |
|---|---|---|---|---|---|---|---|
0 |
788890 |
39 |
5295 |
314.2 |
35.66 |
Amino acid frequency
Ala |
Cys |
Asp |
Glu |
Phe |
Gly |
His |
Ile |
Lys |
Leu |
|---|---|---|---|---|---|---|---|---|---|
4.944 ± 0.057 | 0.833 ± 0.019 |
4.929 ± 0.041 | 8.003 ± 0.065 |
4.921 ± 0.049 | 6.954 ± 0.06 |
1.284 ± 0.019 | 10.065 ± 0.055 |
9.906 ± 0.071 | 9.706 ± 0.053 |
Met |
Asn |
Gln |
Pro |
Arg |
Ser |
Thr |
Val |
Trp |
Tyr |
|---|---|---|---|---|---|---|---|---|---|
2.474 ± 0.026 | 6.47 ± 0.061 |
2.874 ± 0.03 | 2.065 ± 0.022 |
3.322 ± 0.037 | 5.701 ± 0.038 |
4.795 ± 0.054 | 5.829 ± 0.049 |
0.656 ± 0.014 | 4.267 ± 0.036 |
Most of the basic statistics you can see at this page can be downloaded from this CSV file
Proteome-pI is available under Creative Commons Attribution-NoDerivs license, for more details see here
| Reference: Kozlowski LP. Proteome-pI 2.0: Proteome Isoelectric Point Database Update. Nucleic Acids Res. 2021, doi: 10.1093/nar/gkab944 | Contact: Lukasz P. Kozlowski |
