Parolsenella catena
Taxonomy: cellular organisms; Bacteria; Terrabacteria group; Actinobacteria; Coriobacteriia; Coriobacteriales; Atopobiaceae; Parolsenella
Average proteome isoelectric point is 5.69
Get precalculated fractions of proteins

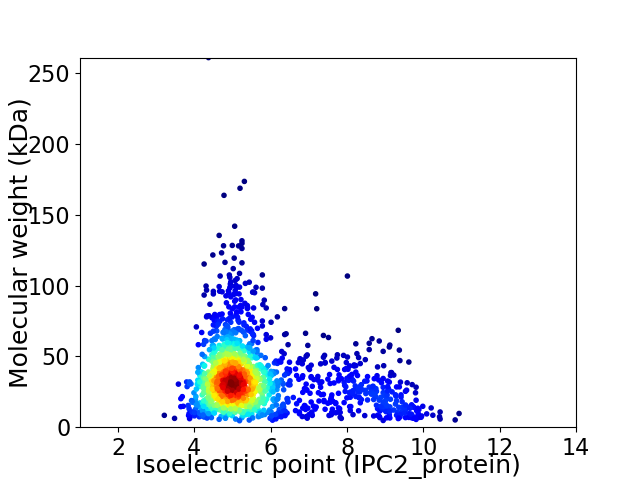
Virtual 2D-PAGE plot for 1584 proteins (isoelectric point calculated using IPC2_protein)
Get csv file with sequences according to given criteria:
* You can choose from 21 different methods for calculating isoelectric point
Summary statistics related to proteome-wise predictions


Protein with the lowest isoelectric point:
>tr|A0A3G9JXY2|A0A3G9JXY2_9ACTN RNA polymerase sigma-37 factor OS=Parolsenella catena OX=2003188 GN=sigB PE=4 SV=1
MM1 pKa = 7.95DD2 pKa = 6.32PIIISVDD9 pKa = 3.03EE10 pKa = 4.25RR11 pKa = 11.84LAGAGSVLPVAGHH24 pKa = 7.01IDD26 pKa = 3.78DD27 pKa = 5.53DD28 pKa = 4.84SYY30 pKa = 12.17SVGDD34 pKa = 3.68HH35 pKa = 7.2DD36 pKa = 4.84FRR38 pKa = 11.84LPGGIDD44 pKa = 3.49YY45 pKa = 11.23DD46 pKa = 4.54LVLTNAGEE54 pKa = 4.76GILASGIVRR63 pKa = 11.84AHH65 pKa = 6.11VLGTCDD71 pKa = 3.37RR72 pKa = 11.84CLEE75 pKa = 4.22DD76 pKa = 4.85AEE78 pKa = 4.46FDD80 pKa = 3.38IASEE84 pKa = 3.87VDD86 pKa = 3.47EE87 pKa = 4.7YY88 pKa = 11.74FLFEE92 pKa = 4.55APAEE96 pKa = 4.13EE97 pKa = 4.98DD98 pKa = 3.61LSDD101 pKa = 5.94DD102 pKa = 3.64EE103 pKa = 6.06DD104 pKa = 3.85EE105 pKa = 4.7VDD107 pKa = 4.43FSLVGEE113 pKa = 4.4DD114 pKa = 3.35HH115 pKa = 6.96TIDD118 pKa = 3.4LAEE121 pKa = 5.5PIMAAIVMEE130 pKa = 4.39TPFVVLCRR138 pKa = 11.84EE139 pKa = 4.22DD140 pKa = 4.47CKK142 pKa = 11.13GLCPHH147 pKa = 7.15CGANLNEE154 pKa = 4.51GDD156 pKa = 4.28CGCAEE161 pKa = 4.21KK162 pKa = 10.08MASVDD167 pKa = 3.25AATGPFAALAGLRR180 pKa = 11.84LDD182 pKa = 5.36GEE184 pKa = 5.23DD185 pKa = 4.04GDD187 pKa = 4.63SAQDD191 pKa = 3.19
MM1 pKa = 7.95DD2 pKa = 6.32PIIISVDD9 pKa = 3.03EE10 pKa = 4.25RR11 pKa = 11.84LAGAGSVLPVAGHH24 pKa = 7.01IDD26 pKa = 3.78DD27 pKa = 5.53DD28 pKa = 4.84SYY30 pKa = 12.17SVGDD34 pKa = 3.68HH35 pKa = 7.2DD36 pKa = 4.84FRR38 pKa = 11.84LPGGIDD44 pKa = 3.49YY45 pKa = 11.23DD46 pKa = 4.54LVLTNAGEE54 pKa = 4.76GILASGIVRR63 pKa = 11.84AHH65 pKa = 6.11VLGTCDD71 pKa = 3.37RR72 pKa = 11.84CLEE75 pKa = 4.22DD76 pKa = 4.85AEE78 pKa = 4.46FDD80 pKa = 3.38IASEE84 pKa = 3.87VDD86 pKa = 3.47EE87 pKa = 4.7YY88 pKa = 11.74FLFEE92 pKa = 4.55APAEE96 pKa = 4.13EE97 pKa = 4.98DD98 pKa = 3.61LSDD101 pKa = 5.94DD102 pKa = 3.64EE103 pKa = 6.06DD104 pKa = 3.85EE105 pKa = 4.7VDD107 pKa = 4.43FSLVGEE113 pKa = 4.4DD114 pKa = 3.35HH115 pKa = 6.96TIDD118 pKa = 3.4LAEE121 pKa = 5.5PIMAAIVMEE130 pKa = 4.39TPFVVLCRR138 pKa = 11.84EE139 pKa = 4.22DD140 pKa = 4.47CKK142 pKa = 11.13GLCPHH147 pKa = 7.15CGANLNEE154 pKa = 4.51GDD156 pKa = 4.28CGCAEE161 pKa = 4.21KK162 pKa = 10.08MASVDD167 pKa = 3.25AATGPFAALAGLRR180 pKa = 11.84LDD182 pKa = 5.36GEE184 pKa = 5.23DD185 pKa = 4.04GDD187 pKa = 4.63SAQDD191 pKa = 3.19
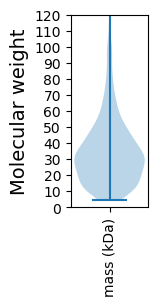
Molecular weight: 20.14 kDa
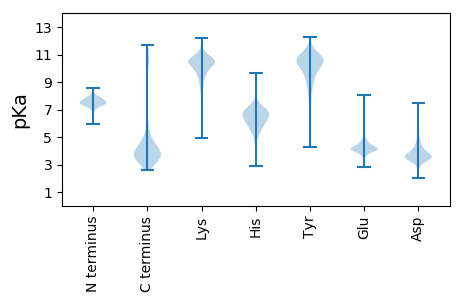
Isoelectric point according different methods:
Protein with the highest isoelectric point:
>tr|A0A3G9K9Q8|A0A3G9K9Q8_9ACTN Molybdate ABC transporter substrate-binding protein OS=Parolsenella catena OX=2003188 GN=modA PE=3 SV=1
MM1 pKa = 7.19TARR4 pKa = 11.84FTVIVIAKK12 pKa = 7.22MWNSILSLSFMGAAPFRR29 pKa = 11.84PPRR32 pKa = 11.84QAASVRR38 pKa = 11.84RR39 pKa = 11.84FLAIRR44 pKa = 11.84GAAKK48 pKa = 10.43SLFGFHH54 pKa = 7.22AARR57 pKa = 11.84GRR59 pKa = 11.84LPRR62 pKa = 11.84SRR64 pKa = 11.84APLASPDD71 pKa = 3.63GGPFLASPVPLAATAGRR88 pKa = 11.84PRR90 pKa = 11.84PP91 pKa = 3.68
MM1 pKa = 7.19TARR4 pKa = 11.84FTVIVIAKK12 pKa = 7.22MWNSILSLSFMGAAPFRR29 pKa = 11.84PPRR32 pKa = 11.84QAASVRR38 pKa = 11.84RR39 pKa = 11.84FLAIRR44 pKa = 11.84GAAKK48 pKa = 10.43SLFGFHH54 pKa = 7.22AARR57 pKa = 11.84GRR59 pKa = 11.84LPRR62 pKa = 11.84SRR64 pKa = 11.84APLASPDD71 pKa = 3.63GGPFLASPVPLAATAGRR88 pKa = 11.84PRR90 pKa = 11.84PP91 pKa = 3.68
Molecular weight: 9.68 kDa
Isoelectric point according different methods:
Peptides (in silico digests for buttom-up proteomics)
Below you can find in silico digests of the whole proteome with Trypsin, Chymotrypsin, Trypsin+LysC, LysN, ArgC proteases suitable for different mass spec machines.| Try ESI |
 |
|---|
| ChTry ESI |
 |
|---|
| ArgC ESI |
 |
|---|
| LysN ESI |
 |
|---|
| TryLysC ESI |
 |
|---|
| Try MALDI |
 |
|---|
| ChTry MALDI |
 |
|---|
| ArgC MALDI |
 |
|---|
| LysN MALDI |
 |
|---|
| TryLysC MALDI |
 |
|---|
| Try LTQ |
 |
|---|
| ChTry LTQ |
 |
|---|
| ArgC LTQ |
 |
|---|
| LysN LTQ |
 |
|---|
| TryLysC LTQ |
 |
|---|
| Try MSlow |
 |
|---|
| ChTry MSlow |
 |
|---|
| ArgC MSlow |
 |
|---|
| LysN MSlow |
 |
|---|
| TryLysC MSlow |
 |
|---|
| Try MShigh |
 |
|---|
| ChTry MShigh |
 |
|---|
| ArgC MShigh |
 |
|---|
| LysN MShigh |
 |
|---|
| TryLysC MShigh |
 |
|---|
General Statistics
Number of major isoforms |
Number of additional isoforms |
Number of all proteins |
Number of amino acids |
Min. Seq. Length |
Max. Seq. Length |
Avg. Seq. Length |
Avg. Mol. Weight |
|---|---|---|---|---|---|---|---|
0 |
527162 |
42 |
2467 |
332.8 |
36.02 |
Amino acid frequency
Ala |
Cys |
Asp |
Glu |
Phe |
Gly |
His |
Ile |
Lys |
Leu |
|---|---|---|---|---|---|---|---|---|---|
11.944 ± 0.086 | 1.622 ± 0.027 |
6.356 ± 0.047 | 6.689 ± 0.053 |
3.266 ± 0.034 | 8.615 ± 0.059 |
2.023 ± 0.029 | 4.608 ± 0.049 |
3.445 ± 0.048 | 9.232 ± 0.067 |
Met |
Asn |
Gln |
Pro |
Arg |
Ser |
Thr |
Val |
Trp |
Tyr |
|---|---|---|---|---|---|---|---|---|---|
2.593 ± 0.028 | 2.743 ± 0.037 |
4.331 ± 0.04 | 2.749 ± 0.029 |
6.467 ± 0.066 | 5.856 ± 0.048 |
5.414 ± 0.048 | 8.367 ± 0.057 |
1.058 ± 0.023 | 2.622 ± 0.031 |
Most of the basic statistics you can see at this page can be downloaded from this CSV file
Proteome-pI is available under Creative Commons Attribution-NoDerivs license, for more details see here
| Reference: Kozlowski LP. Proteome-pI 2.0: Proteome Isoelectric Point Database Update. Nucleic Acids Res. 2021, doi: 10.1093/nar/gkab944 | Contact: Lukasz P. Kozlowski |
