Streptomyces sp. CB01635
Taxonomy: cellular organisms; Bacteria; Terrabacteria group; Actinobacteria; Actinomycetia; Streptomycetales; Streptomycetaceae; Streptomyces; unclassified Streptomyces
Average proteome isoelectric point is 6.36
Get precalculated fractions of proteins

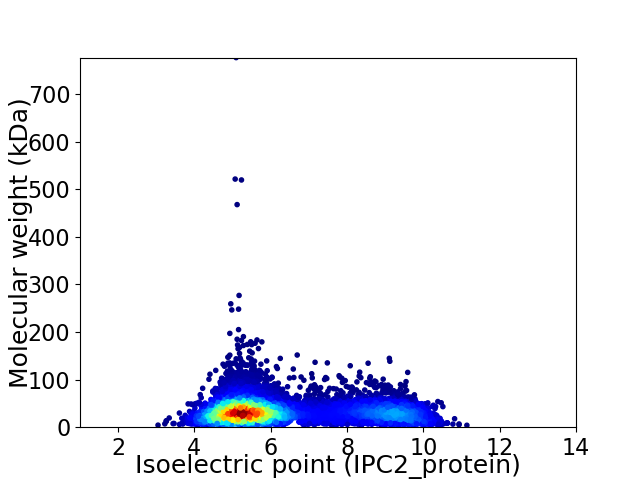
Virtual 2D-PAGE plot for 8519 proteins (isoelectric point calculated using IPC2_protein)
Get csv file with sequences according to given criteria:
* You can choose from 21 different methods for calculating isoelectric point
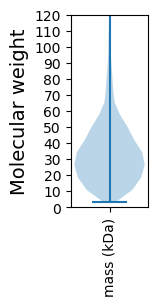
Summary statistics related to proteome-wise predictions


Protein with the lowest isoelectric point:
>tr|A0A2M9JTU8|A0A2M9JTU8_9ACTN XRE family transcriptional regulator OS=Streptomyces sp. CB01635 OX=2020326 GN=CG723_18175 PE=4 SV=1
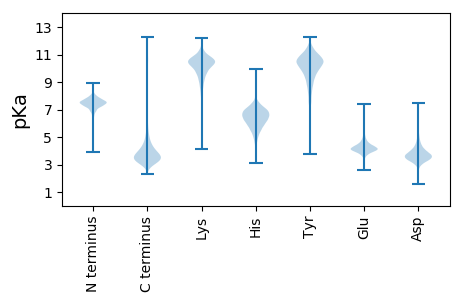
MM1 pKa = 7.64HH2 pKa = 7.25SRR4 pKa = 11.84PISRR8 pKa = 11.84RR9 pKa = 11.84TLRR12 pKa = 11.84AASAVMLVVGAGLTGPVLLAGTAGAATSPATAAIDD47 pKa = 3.78GRR49 pKa = 11.84AVAYY53 pKa = 7.55TAAPGQTNDD62 pKa = 3.34VTVTASKK69 pKa = 10.82DD70 pKa = 3.59GADD73 pKa = 3.12ITYY76 pKa = 10.71VIDD79 pKa = 4.03DD80 pKa = 4.17VVTIGAGDD88 pKa = 3.85GCSYY92 pKa = 10.71PSSTDD97 pKa = 3.05QTQITCTITTVDD109 pKa = 3.58SQDD112 pKa = 3.57PYY114 pKa = 12.01ASLEE118 pKa = 4.04LSLGDD123 pKa = 3.79GNDD126 pKa = 2.81VLTYY130 pKa = 10.97DD131 pKa = 3.54NQTDD135 pKa = 3.44EE136 pKa = 4.79TYY138 pKa = 11.13NFASIDD144 pKa = 3.61MGDD147 pKa = 3.95GKK149 pKa = 9.89DD150 pKa = 3.43TLTEE154 pKa = 3.97TGGVQGNGVTGGAGDD169 pKa = 4.74DD170 pKa = 3.88NLSVGPVTVVLGGDD184 pKa = 3.6GNDD187 pKa = 4.27TIDD190 pKa = 3.89AADD193 pKa = 3.64GTVAQGGIGNDD204 pKa = 4.0TIHH207 pKa = 7.06SRR209 pKa = 11.84GEE211 pKa = 3.78DD212 pKa = 3.41SAVDD216 pKa = 3.73GGAGRR221 pKa = 11.84DD222 pKa = 3.91LIYY225 pKa = 10.96GGADD229 pKa = 3.19RR230 pKa = 11.84QSLSGGDD237 pKa = 3.87DD238 pKa = 3.38NDD240 pKa = 4.43TIRR243 pKa = 11.84GGDD246 pKa = 3.54GSDD249 pKa = 3.36YY250 pKa = 10.97LYY252 pKa = 10.98GGKK255 pKa = 10.32GDD257 pKa = 3.7DD258 pKa = 3.61VLYY261 pKa = 11.28GEE263 pKa = 5.58AGDD266 pKa = 3.75DD267 pKa = 3.72TIYY270 pKa = 11.31GNSGNDD276 pKa = 3.29KK277 pKa = 10.55LYY279 pKa = 11.24GGAGTDD285 pKa = 3.71TLSGGPGTNVVHH297 pKa = 6.97QDD299 pKa = 2.85
MM1 pKa = 7.64HH2 pKa = 7.25SRR4 pKa = 11.84PISRR8 pKa = 11.84RR9 pKa = 11.84TLRR12 pKa = 11.84AASAVMLVVGAGLTGPVLLAGTAGAATSPATAAIDD47 pKa = 3.78GRR49 pKa = 11.84AVAYY53 pKa = 7.55TAAPGQTNDD62 pKa = 3.34VTVTASKK69 pKa = 10.82DD70 pKa = 3.59GADD73 pKa = 3.12ITYY76 pKa = 10.71VIDD79 pKa = 4.03DD80 pKa = 4.17VVTIGAGDD88 pKa = 3.85GCSYY92 pKa = 10.71PSSTDD97 pKa = 3.05QTQITCTITTVDD109 pKa = 3.58SQDD112 pKa = 3.57PYY114 pKa = 12.01ASLEE118 pKa = 4.04LSLGDD123 pKa = 3.79GNDD126 pKa = 2.81VLTYY130 pKa = 10.97DD131 pKa = 3.54NQTDD135 pKa = 3.44EE136 pKa = 4.79TYY138 pKa = 11.13NFASIDD144 pKa = 3.61MGDD147 pKa = 3.95GKK149 pKa = 9.89DD150 pKa = 3.43TLTEE154 pKa = 3.97TGGVQGNGVTGGAGDD169 pKa = 4.74DD170 pKa = 3.88NLSVGPVTVVLGGDD184 pKa = 3.6GNDD187 pKa = 4.27TIDD190 pKa = 3.89AADD193 pKa = 3.64GTVAQGGIGNDD204 pKa = 4.0TIHH207 pKa = 7.06SRR209 pKa = 11.84GEE211 pKa = 3.78DD212 pKa = 3.41SAVDD216 pKa = 3.73GGAGRR221 pKa = 11.84DD222 pKa = 3.91LIYY225 pKa = 10.96GGADD229 pKa = 3.19RR230 pKa = 11.84QSLSGGDD237 pKa = 3.87DD238 pKa = 3.38NDD240 pKa = 4.43TIRR243 pKa = 11.84GGDD246 pKa = 3.54GSDD249 pKa = 3.36YY250 pKa = 10.97LYY252 pKa = 10.98GGKK255 pKa = 10.32GDD257 pKa = 3.7DD258 pKa = 3.61VLYY261 pKa = 11.28GEE263 pKa = 5.58AGDD266 pKa = 3.75DD267 pKa = 3.72TIYY270 pKa = 11.31GNSGNDD276 pKa = 3.29KK277 pKa = 10.55LYY279 pKa = 11.24GGAGTDD285 pKa = 3.71TLSGGPGTNVVHH297 pKa = 6.97QDD299 pKa = 2.85
Molecular weight: 29.72 kDa
Isoelectric point according different methods:
Protein with the highest isoelectric point:
>tr|A0A2M9JF95|A0A2M9JF95_9ACTN FAD-linked oxidoreductase OS=Streptomyces sp. CB01635 OX=2020326 GN=CG723_45030 PE=3 SV=1
MM1 pKa = 7.4GSVIKK6 pKa = 10.42KK7 pKa = 8.47RR8 pKa = 11.84RR9 pKa = 11.84KK10 pKa = 9.22RR11 pKa = 11.84MAKK14 pKa = 9.41KK15 pKa = 9.99KK16 pKa = 9.72HH17 pKa = 5.74RR18 pKa = 11.84KK19 pKa = 7.77LLKK22 pKa = 8.07RR23 pKa = 11.84TRR25 pKa = 11.84VQRR28 pKa = 11.84RR29 pKa = 11.84NKK31 pKa = 9.81KK32 pKa = 9.63
MM1 pKa = 7.4GSVIKK6 pKa = 10.42KK7 pKa = 8.47RR8 pKa = 11.84RR9 pKa = 11.84KK10 pKa = 9.22RR11 pKa = 11.84MAKK14 pKa = 9.41KK15 pKa = 9.99KK16 pKa = 9.72HH17 pKa = 5.74RR18 pKa = 11.84KK19 pKa = 7.77LLKK22 pKa = 8.07RR23 pKa = 11.84TRR25 pKa = 11.84VQRR28 pKa = 11.84RR29 pKa = 11.84NKK31 pKa = 9.81KK32 pKa = 9.63
Molecular weight: 4.05 kDa
Isoelectric point according different methods:
Peptides (in silico digests for buttom-up proteomics)
Below you can find in silico digests of the whole proteome with Trypsin, Chymotrypsin, Trypsin+LysC, LysN, ArgC proteases suitable for different mass spec machines.| Try ESI |
 |
|---|
| ChTry ESI |
 |
|---|
| ArgC ESI |
 |
|---|
| LysN ESI |
 |
|---|
| TryLysC ESI |
 |
|---|
| Try MALDI |
 |
|---|
| ChTry MALDI |
 |
|---|
| ArgC MALDI |
 |
|---|
| LysN MALDI |
 |
|---|
| TryLysC MALDI |
 |
|---|
| Try LTQ |
 |
|---|
| ChTry LTQ |
 |
|---|
| ArgC LTQ |
 |
|---|
| LysN LTQ |
 |
|---|
| TryLysC LTQ |
 |
|---|
| Try MSlow |
 |
|---|
| ChTry MSlow |
 |
|---|
| ArgC MSlow |
 |
|---|
| LysN MSlow |
 |
|---|
| TryLysC MSlow |
 |
|---|
| Try MShigh |
 |
|---|
| ChTry MShigh |
 |
|---|
| ArgC MShigh |
 |
|---|
| LysN MShigh |
 |
|---|
| TryLysC MShigh |
 |
|---|
General Statistics
Number of major isoforms |
Number of additional isoforms |
Number of all proteins |
Number of amino acids |
Min. Seq. Length |
Max. Seq. Length |
Avg. Seq. Length |
Avg. Mol. Weight |
|---|---|---|---|---|---|---|---|
0 |
2820413 |
27 |
7351 |
331.1 |
35.46 |
Amino acid frequency
Ala |
Cys |
Asp |
Glu |
Phe |
Gly |
His |
Ile |
Lys |
Leu |
|---|---|---|---|---|---|---|---|---|---|
13.359 ± 0.043 | 0.785 ± 0.007 |
6.072 ± 0.022 | 5.533 ± 0.025 |
2.845 ± 0.015 | 9.491 ± 0.023 |
2.332 ± 0.015 | 3.326 ± 0.018 |
2.374 ± 0.024 | 10.228 ± 0.032 |
Met |
Asn |
Gln |
Pro |
Arg |
Ser |
Thr |
Val |
Trp |
Tyr |
|---|---|---|---|---|---|---|---|---|---|
1.797 ± 0.011 | 1.842 ± 0.013 |
5.955 ± 0.024 | 2.843 ± 0.017 |
7.72 ± 0.028 | 5.241 ± 0.022 |
6.162 ± 0.023 | 8.43 ± 0.024 |
1.527 ± 0.011 | 2.137 ± 0.012 |
Most of the basic statistics you can see at this page can be downloaded from this CSV file
Proteome-pI is available under Creative Commons Attribution-NoDerivs license, for more details see here
| Reference: Kozlowski LP. Proteome-pI 2.0: Proteome Isoelectric Point Database Update. Nucleic Acids Res. 2021, doi: 10.1093/nar/gkab944 | Contact: Lukasz P. Kozlowski |
