Litchfieldia salsus
Taxonomy: cellular organisms; Bacteria; Terrabacteria group; Firmicutes; Bacilli; Bacillales; Bacillaceae; Litchfieldia
Average proteome isoelectric point is 6.21
Get precalculated fractions of proteins

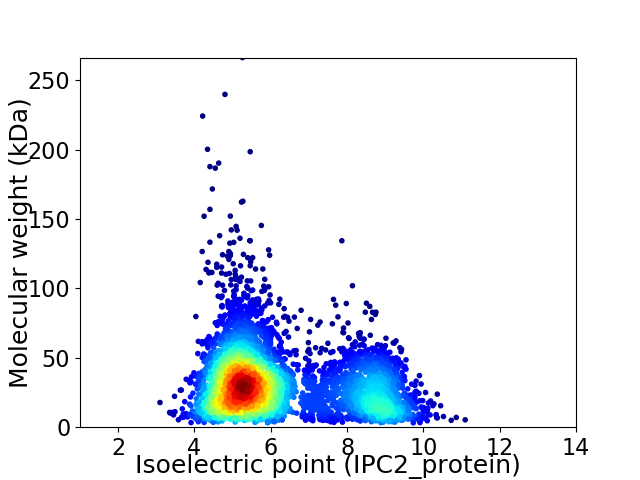
Virtual 2D-PAGE plot for 4559 proteins (isoelectric point calculated using IPC2_protein)
Get csv file with sequences according to given criteria:
* You can choose from 21 different methods for calculating isoelectric point
Summary statistics related to proteome-wise predictions


Protein with the lowest isoelectric point:
>tr|A0A1H0TDH0|A0A1H0TDH0_9BACI Molybdenum cofactor cytidylyltransferase OS=Litchfieldia salsus OX=930152 GN=SAMN05216565_103415 PE=4 SV=1
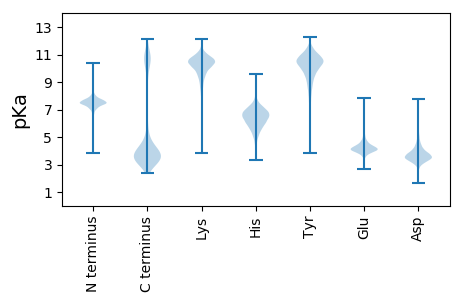
MM1 pKa = 7.5SLEE4 pKa = 3.82WFDD7 pKa = 3.9RR8 pKa = 11.84VSGEE12 pKa = 4.11LQDD15 pKa = 4.16HH16 pKa = 6.79LEE18 pKa = 4.52SICDD22 pKa = 3.34KK23 pKa = 10.24YY24 pKa = 11.58DD25 pKa = 3.46QVGHH29 pKa = 5.36MSIDD33 pKa = 3.19RR34 pKa = 11.84GAKK37 pKa = 8.72HH38 pKa = 5.88PRR40 pKa = 11.84IEE42 pKa = 4.38FFVEE46 pKa = 4.15TTDD49 pKa = 4.6DD50 pKa = 3.75GEE52 pKa = 4.29RR53 pKa = 11.84DD54 pKa = 3.89YY55 pKa = 11.47FCSLFFDD62 pKa = 3.7PHH64 pKa = 7.26NEE66 pKa = 3.61EE67 pKa = 5.29FYY69 pKa = 11.35VEE71 pKa = 5.54SYY73 pKa = 11.46DD74 pKa = 5.76LDD76 pKa = 3.8LQQEE80 pKa = 4.29SRR82 pKa = 11.84AILLDD87 pKa = 3.22IEE89 pKa = 5.87DD90 pKa = 3.99IVDD93 pKa = 3.78CVHH96 pKa = 6.77EE97 pKa = 4.54SFHH100 pKa = 8.1EE101 pKa = 3.96YY102 pKa = 10.47MNDD105 pKa = 3.64DD106 pKa = 3.96EE107 pKa = 6.78DD108 pKa = 5.21DD109 pKa = 3.89EE110 pKa = 4.75EE111 pKa = 4.68YY112 pKa = 10.67EE113 pKa = 4.41YY114 pKa = 11.52YY115 pKa = 10.99LEE117 pKa = 4.21TTEE120 pKa = 6.29DD121 pKa = 4.53DD122 pKa = 3.95DD123 pKa = 6.35DD124 pKa = 6.57LYY126 pKa = 11.71LADD129 pKa = 5.89DD130 pKa = 4.32DD131 pKa = 5.21SEE133 pKa = 5.19NEE135 pKa = 4.0TEE137 pKa = 4.59VYY139 pKa = 10.38QEE141 pKa = 5.07IDD143 pKa = 3.87VEE145 pKa = 4.39WTTPEE150 pKa = 3.62VTAYY154 pKa = 10.01SHH156 pKa = 6.32EE157 pKa = 4.72DD158 pKa = 3.59EE159 pKa = 5.67VEE161 pKa = 3.79VTYY164 pKa = 10.93QFGIVQEE171 pKa = 4.4TGDD174 pKa = 3.51GVLRR178 pKa = 11.84RR179 pKa = 11.84VNRR182 pKa = 11.84VVTTDD187 pKa = 2.94EE188 pKa = 4.85DD189 pKa = 4.52LIEE192 pKa = 5.07DD193 pKa = 3.66EE194 pKa = 5.25SNFIFSKK201 pKa = 10.88EE202 pKa = 3.9EE203 pKa = 3.46ASTIIALIATHH214 pKa = 6.64MDD216 pKa = 3.34SLSDD220 pKa = 3.84FDD222 pKa = 6.25FDD224 pKa = 5.34MIDD227 pKa = 3.07GG228 pKa = 4.16
MM1 pKa = 7.5SLEE4 pKa = 3.82WFDD7 pKa = 3.9RR8 pKa = 11.84VSGEE12 pKa = 4.11LQDD15 pKa = 4.16HH16 pKa = 6.79LEE18 pKa = 4.52SICDD22 pKa = 3.34KK23 pKa = 10.24YY24 pKa = 11.58DD25 pKa = 3.46QVGHH29 pKa = 5.36MSIDD33 pKa = 3.19RR34 pKa = 11.84GAKK37 pKa = 8.72HH38 pKa = 5.88PRR40 pKa = 11.84IEE42 pKa = 4.38FFVEE46 pKa = 4.15TTDD49 pKa = 4.6DD50 pKa = 3.75GEE52 pKa = 4.29RR53 pKa = 11.84DD54 pKa = 3.89YY55 pKa = 11.47FCSLFFDD62 pKa = 3.7PHH64 pKa = 7.26NEE66 pKa = 3.61EE67 pKa = 5.29FYY69 pKa = 11.35VEE71 pKa = 5.54SYY73 pKa = 11.46DD74 pKa = 5.76LDD76 pKa = 3.8LQQEE80 pKa = 4.29SRR82 pKa = 11.84AILLDD87 pKa = 3.22IEE89 pKa = 5.87DD90 pKa = 3.99IVDD93 pKa = 3.78CVHH96 pKa = 6.77EE97 pKa = 4.54SFHH100 pKa = 8.1EE101 pKa = 3.96YY102 pKa = 10.47MNDD105 pKa = 3.64DD106 pKa = 3.96EE107 pKa = 6.78DD108 pKa = 5.21DD109 pKa = 3.89EE110 pKa = 4.75EE111 pKa = 4.68YY112 pKa = 10.67EE113 pKa = 4.41YY114 pKa = 11.52YY115 pKa = 10.99LEE117 pKa = 4.21TTEE120 pKa = 6.29DD121 pKa = 4.53DD122 pKa = 3.95DD123 pKa = 6.35DD124 pKa = 6.57LYY126 pKa = 11.71LADD129 pKa = 5.89DD130 pKa = 4.32DD131 pKa = 5.21SEE133 pKa = 5.19NEE135 pKa = 4.0TEE137 pKa = 4.59VYY139 pKa = 10.38QEE141 pKa = 5.07IDD143 pKa = 3.87VEE145 pKa = 4.39WTTPEE150 pKa = 3.62VTAYY154 pKa = 10.01SHH156 pKa = 6.32EE157 pKa = 4.72DD158 pKa = 3.59EE159 pKa = 5.67VEE161 pKa = 3.79VTYY164 pKa = 10.93QFGIVQEE171 pKa = 4.4TGDD174 pKa = 3.51GVLRR178 pKa = 11.84RR179 pKa = 11.84VNRR182 pKa = 11.84VVTTDD187 pKa = 2.94EE188 pKa = 4.85DD189 pKa = 4.52LIEE192 pKa = 5.07DD193 pKa = 3.66EE194 pKa = 5.25SNFIFSKK201 pKa = 10.88EE202 pKa = 3.9EE203 pKa = 3.46ASTIIALIATHH214 pKa = 6.64MDD216 pKa = 3.34SLSDD220 pKa = 3.84FDD222 pKa = 6.25FDD224 pKa = 5.34MIDD227 pKa = 3.07GG228 pKa = 4.16
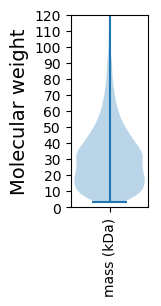
Molecular weight: 26.79 kDa
Isoelectric point according different methods:
Protein with the highest isoelectric point:
>tr|A0A1H0UM01|A0A1H0UM01_9BACI NAD(P)-dependent dehydrogenase short-chain alcohol dehydrogenase family OS=Litchfieldia salsus OX=930152 GN=SAMN05216565_10517 PE=4 SV=1
MM1 pKa = 7.35KK2 pKa = 9.43RR3 pKa = 11.84TYY5 pKa = 10.21QPNNRR10 pKa = 11.84KK11 pKa = 9.13HH12 pKa = 6.54SKK14 pKa = 8.71VHH16 pKa = 5.75GFRR19 pKa = 11.84KK20 pKa = 10.02RR21 pKa = 11.84MSTKK25 pKa = 10.22NGRR28 pKa = 11.84QVLARR33 pKa = 11.84RR34 pKa = 11.84RR35 pKa = 11.84RR36 pKa = 11.84KK37 pKa = 9.05GRR39 pKa = 11.84KK40 pKa = 8.7VLSAA44 pKa = 4.05
MM1 pKa = 7.35KK2 pKa = 9.43RR3 pKa = 11.84TYY5 pKa = 10.21QPNNRR10 pKa = 11.84KK11 pKa = 9.13HH12 pKa = 6.54SKK14 pKa = 8.71VHH16 pKa = 5.75GFRR19 pKa = 11.84KK20 pKa = 10.02RR21 pKa = 11.84MSTKK25 pKa = 10.22NGRR28 pKa = 11.84QVLARR33 pKa = 11.84RR34 pKa = 11.84RR35 pKa = 11.84RR36 pKa = 11.84KK37 pKa = 9.05GRR39 pKa = 11.84KK40 pKa = 8.7VLSAA44 pKa = 4.05
Molecular weight: 5.32 kDa
Isoelectric point according different methods:
Peptides (in silico digests for buttom-up proteomics)
Below you can find in silico digests of the whole proteome with Trypsin, Chymotrypsin, Trypsin+LysC, LysN, ArgC proteases suitable for different mass spec machines.| Try ESI |
 |
|---|
| ChTry ESI |
 |
|---|
| ArgC ESI |
 |
|---|
| LysN ESI |
 |
|---|
| TryLysC ESI |
 |
|---|
| Try MALDI |
 |
|---|
| ChTry MALDI |
 |
|---|
| ArgC MALDI |
 |
|---|
| LysN MALDI |
 |
|---|
| TryLysC MALDI |
 |
|---|
| Try LTQ |
 |
|---|
| ChTry LTQ |
 |
|---|
| ArgC LTQ |
 |
|---|
| LysN LTQ |
 |
|---|
| TryLysC LTQ |
 |
|---|
| Try MSlow |
 |
|---|
| ChTry MSlow |
 |
|---|
| ArgC MSlow |
 |
|---|
| LysN MSlow |
 |
|---|
| TryLysC MSlow |
 |
|---|
| Try MShigh |
 |
|---|
| ChTry MShigh |
 |
|---|
| ArgC MShigh |
 |
|---|
| LysN MShigh |
 |
|---|
| TryLysC MShigh |
 |
|---|
General Statistics
Number of major isoforms |
Number of additional isoforms |
Number of all proteins |
Number of amino acids |
Min. Seq. Length |
Max. Seq. Length |
Avg. Seq. Length |
Avg. Mol. Weight |
|---|---|---|---|---|---|---|---|
0 |
1338924 |
28 |
2383 |
293.7 |
33.07 |
Amino acid frequency
Ala |
Cys |
Asp |
Glu |
Phe |
Gly |
His |
Ile |
Lys |
Leu |
|---|---|---|---|---|---|---|---|---|---|
6.159 ± 0.037 | 0.7 ± 0.012 |
5.106 ± 0.033 | 7.59 ± 0.043 |
4.636 ± 0.035 | 6.759 ± 0.034 |
2.052 ± 0.019 | 8.367 ± 0.037 |
6.856 ± 0.034 | 9.815 ± 0.042 |
Met |
Asn |
Gln |
Pro |
Arg |
Ser |
Thr |
Val |
Trp |
Tyr |
|---|---|---|---|---|---|---|---|---|---|
2.659 ± 0.019 | 4.841 ± 0.028 |
3.479 ± 0.022 | 3.614 ± 0.026 |
3.765 ± 0.026 | 6.379 ± 0.029 |
5.559 ± 0.028 | 6.938 ± 0.033 |
1.04 ± 0.014 | 3.684 ± 0.023 |
Most of the basic statistics you can see at this page can be downloaded from this CSV file
Proteome-pI is available under Creative Commons Attribution-NoDerivs license, for more details see here
| Reference: Kozlowski LP. Proteome-pI 2.0: Proteome Isoelectric Point Database Update. Nucleic Acids Res. 2021, doi: 10.1093/nar/gkab944 | Contact: Lukasz P. Kozlowski |
