Bacteroides acidifaciens
Taxonomy: cellular organisms; Bacteria; FCB group; Bacteroidetes/Chlorobi group; Bacteroidetes; Bacteroidia; Bacteroidales; Bacteroidaceae; Bacteroides
Average proteome isoelectric point is 6.46
Get precalculated fractions of proteins

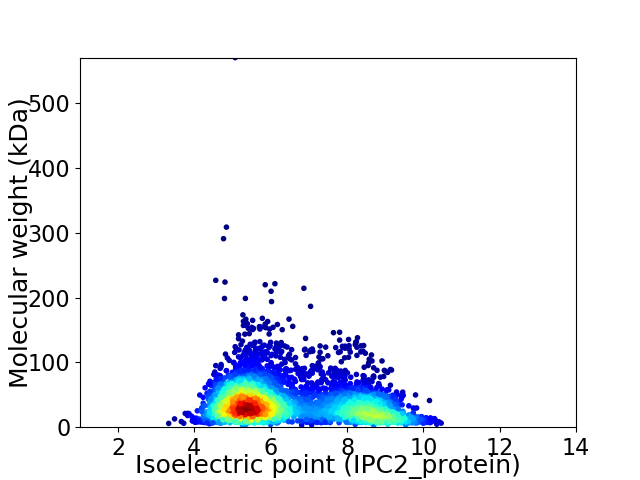
Virtual 2D-PAGE plot for 3874 proteins (isoelectric point calculated using IPC2_protein)
Get csv file with sequences according to given criteria:
* You can choose from 21 different methods for calculating isoelectric point
Summary statistics related to proteome-wise predictions


Protein with the lowest isoelectric point:
>tr|A0A3L8A5Z0|A0A3L8A5Z0_9BACE DUF5689 domain-containing protein OS=Bacteroides acidifaciens OX=85831 GN=D7Y07_12840 PE=4 SV=1
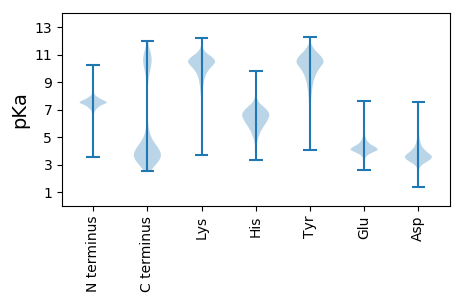
MM1 pKa = 6.9EE2 pKa = 5.64AKK4 pKa = 10.07VLSEE8 pKa = 3.7AKK10 pKa = 10.47VYY12 pKa = 10.65VGTYY16 pKa = 9.99AKK18 pKa = 10.32YY19 pKa = 10.81NNGSLFGAWLDD30 pKa = 3.89LSDD33 pKa = 4.65YY34 pKa = 10.83SDD36 pKa = 3.73KK37 pKa = 11.66EE38 pKa = 4.09EE39 pKa = 4.45FYY41 pKa = 9.88EE42 pKa = 4.99ACRR45 pKa = 11.84EE46 pKa = 4.05LHH48 pKa = 6.63KK49 pKa = 11.13DD50 pKa = 3.63EE51 pKa = 5.18EE52 pKa = 4.44DD53 pKa = 3.48AEE55 pKa = 4.74YY56 pKa = 10.09MFQDD60 pKa = 3.69WEE62 pKa = 4.32NVPEE66 pKa = 4.11GLIGEE71 pKa = 4.39SWISEE76 pKa = 4.08NFFSLRR82 pKa = 11.84DD83 pKa = 3.67AVEE86 pKa = 4.73DD87 pKa = 4.54LDD89 pKa = 4.64DD90 pKa = 4.21TEE92 pKa = 4.6QEE94 pKa = 5.44AFFVWCNYY102 pKa = 9.34KK103 pKa = 10.33SHH105 pKa = 7.42DD106 pKa = 4.14LSEE109 pKa = 4.49EE110 pKa = 4.04DD111 pKa = 3.38VDD113 pKa = 5.22DD114 pKa = 6.47LIRR117 pKa = 11.84DD118 pKa = 3.88FQDD121 pKa = 3.43EE122 pKa = 4.51YY123 pKa = 11.05QGQYY127 pKa = 11.09DD128 pKa = 3.94DD129 pKa = 5.56EE130 pKa = 5.07EE131 pKa = 5.7DD132 pKa = 3.22FAYY135 pKa = 10.08EE136 pKa = 4.79IIEE139 pKa = 4.02EE140 pKa = 4.7CYY142 pKa = 10.69NLPEE146 pKa = 3.93FAKK149 pKa = 10.16TYY151 pKa = 10.62FDD153 pKa = 3.75YY154 pKa = 11.44EE155 pKa = 4.0KK156 pKa = 10.43FARR159 pKa = 11.84DD160 pKa = 5.04LFMCDD165 pKa = 2.54YY166 pKa = 9.94WFDD169 pKa = 3.78DD170 pKa = 3.9GFVFRR175 pKa = 11.84AAA177 pKa = 3.87
MM1 pKa = 6.9EE2 pKa = 5.64AKK4 pKa = 10.07VLSEE8 pKa = 3.7AKK10 pKa = 10.47VYY12 pKa = 10.65VGTYY16 pKa = 9.99AKK18 pKa = 10.32YY19 pKa = 10.81NNGSLFGAWLDD30 pKa = 3.89LSDD33 pKa = 4.65YY34 pKa = 10.83SDD36 pKa = 3.73KK37 pKa = 11.66EE38 pKa = 4.09EE39 pKa = 4.45FYY41 pKa = 9.88EE42 pKa = 4.99ACRR45 pKa = 11.84EE46 pKa = 4.05LHH48 pKa = 6.63KK49 pKa = 11.13DD50 pKa = 3.63EE51 pKa = 5.18EE52 pKa = 4.44DD53 pKa = 3.48AEE55 pKa = 4.74YY56 pKa = 10.09MFQDD60 pKa = 3.69WEE62 pKa = 4.32NVPEE66 pKa = 4.11GLIGEE71 pKa = 4.39SWISEE76 pKa = 4.08NFFSLRR82 pKa = 11.84DD83 pKa = 3.67AVEE86 pKa = 4.73DD87 pKa = 4.54LDD89 pKa = 4.64DD90 pKa = 4.21TEE92 pKa = 4.6QEE94 pKa = 5.44AFFVWCNYY102 pKa = 9.34KK103 pKa = 10.33SHH105 pKa = 7.42DD106 pKa = 4.14LSEE109 pKa = 4.49EE110 pKa = 4.04DD111 pKa = 3.38VDD113 pKa = 5.22DD114 pKa = 6.47LIRR117 pKa = 11.84DD118 pKa = 3.88FQDD121 pKa = 3.43EE122 pKa = 4.51YY123 pKa = 11.05QGQYY127 pKa = 11.09DD128 pKa = 3.94DD129 pKa = 5.56EE130 pKa = 5.07EE131 pKa = 5.7DD132 pKa = 3.22FAYY135 pKa = 10.08EE136 pKa = 4.79IIEE139 pKa = 4.02EE140 pKa = 4.7CYY142 pKa = 10.69NLPEE146 pKa = 3.93FAKK149 pKa = 10.16TYY151 pKa = 10.62FDD153 pKa = 3.75YY154 pKa = 11.44EE155 pKa = 4.0KK156 pKa = 10.43FARR159 pKa = 11.84DD160 pKa = 5.04LFMCDD165 pKa = 2.54YY166 pKa = 9.94WFDD169 pKa = 3.78DD170 pKa = 3.9GFVFRR175 pKa = 11.84AAA177 pKa = 3.87
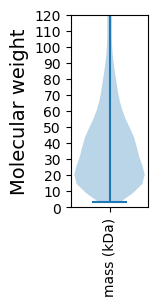
Molecular weight: 21.24 kDa
Isoelectric point according different methods:
Protein with the highest isoelectric point:
>tr|A0A3L8A799|A0A3L8A799_9BACE DUF4374 domain-containing protein OS=Bacteroides acidifaciens OX=85831 GN=D7Y07_11450 PE=4 SV=1
MM1 pKa = 7.26AQALSGFQWNRR12 pKa = 11.84SSRR15 pKa = 11.84WIHH18 pKa = 5.9TIGLTDD24 pKa = 3.81IPNEE28 pKa = 3.89LLYY31 pKa = 11.16SQTNPTGGGFLCPQRR46 pKa = 11.84HH47 pKa = 5.18SKK49 pKa = 10.83VYY51 pKa = 9.89FQLPEE56 pKa = 4.08CFRR59 pKa = 11.84VTEE62 pKa = 4.18NPSTAVGRR70 pKa = 11.84IILRR74 pKa = 11.84SRR76 pKa = 11.84IISRR80 pKa = 11.84FLNQRR85 pKa = 11.84LNNGQAIKK93 pKa = 10.66LKK95 pKa = 10.3EE96 pKa = 3.8
MM1 pKa = 7.26AQALSGFQWNRR12 pKa = 11.84SSRR15 pKa = 11.84WIHH18 pKa = 5.9TIGLTDD24 pKa = 3.81IPNEE28 pKa = 3.89LLYY31 pKa = 11.16SQTNPTGGGFLCPQRR46 pKa = 11.84HH47 pKa = 5.18SKK49 pKa = 10.83VYY51 pKa = 9.89FQLPEE56 pKa = 4.08CFRR59 pKa = 11.84VTEE62 pKa = 4.18NPSTAVGRR70 pKa = 11.84IILRR74 pKa = 11.84SRR76 pKa = 11.84IISRR80 pKa = 11.84FLNQRR85 pKa = 11.84LNNGQAIKK93 pKa = 10.66LKK95 pKa = 10.3EE96 pKa = 3.8
Molecular weight: 10.99 kDa
Isoelectric point according different methods:
Peptides (in silico digests for buttom-up proteomics)
Below you can find in silico digests of the whole proteome with Trypsin, Chymotrypsin, Trypsin+LysC, LysN, ArgC proteases suitable for different mass spec machines.| Try ESI |
 |
|---|
| ChTry ESI |
 |
|---|
| ArgC ESI |
 |
|---|
| LysN ESI |
 |
|---|
| TryLysC ESI |
 |
|---|
| Try MALDI |
 |
|---|
| ChTry MALDI |
 |
|---|
| ArgC MALDI |
 |
|---|
| LysN MALDI |
 |
|---|
| TryLysC MALDI |
 |
|---|
| Try LTQ |
 |
|---|
| ChTry LTQ |
 |
|---|
| ArgC LTQ |
 |
|---|
| LysN LTQ |
 |
|---|
| TryLysC LTQ |
 |
|---|
| Try MSlow |
 |
|---|
| ChTry MSlow |
 |
|---|
| ArgC MSlow |
 |
|---|
| LysN MSlow |
 |
|---|
| TryLysC MSlow |
 |
|---|
| Try MShigh |
 |
|---|
| ChTry MShigh |
 |
|---|
| ArgC MShigh |
 |
|---|
| LysN MShigh |
 |
|---|
| TryLysC MShigh |
 |
|---|
General Statistics
Number of major isoforms |
Number of additional isoforms |
Number of all proteins |
Number of amino acids |
Min. Seq. Length |
Max. Seq. Length |
Avg. Seq. Length |
Avg. Mol. Weight |
|---|---|---|---|---|---|---|---|
0 |
1394016 |
26 |
5085 |
359.8 |
40.68 |
Amino acid frequency
Ala |
Cys |
Asp |
Glu |
Phe |
Gly |
His |
Ile |
Lys |
Leu |
|---|---|---|---|---|---|---|---|---|---|
6.991 ± 0.041 | 1.273 ± 0.017 |
5.58 ± 0.029 | 6.76 ± 0.04 |
4.522 ± 0.027 | 6.756 ± 0.035 |
1.821 ± 0.014 | 6.87 ± 0.04 |
6.874 ± 0.031 | 8.945 ± 0.039 |
Met |
Asn |
Gln |
Pro |
Arg |
Ser |
Thr |
Val |
Trp |
Tyr |
|---|---|---|---|---|---|---|---|---|---|
2.737 ± 0.019 | 5.2 ± 0.033 |
3.662 ± 0.02 | 3.495 ± 0.024 |
4.648 ± 0.029 | 6.089 ± 0.026 |
5.61 ± 0.027 | 6.375 ± 0.029 |
1.28 ± 0.015 | 4.513 ± 0.026 |
Most of the basic statistics you can see at this page can be downloaded from this CSV file
Proteome-pI is available under Creative Commons Attribution-NoDerivs license, for more details see here
| Reference: Kozlowski LP. Proteome-pI 2.0: Proteome Isoelectric Point Database Update. Nucleic Acids Res. 2021, doi: 10.1093/nar/gkab944 | Contact: Lukasz P. Kozlowski |
