Uncultured phage WW-nAnB strain 3
Taxonomy: Viruses; Monodnaviria; Loebvirae; Hofneiviricota; Faserviricetes; Tubulavirales; Inoviridae; environmental samples
Average proteome isoelectric point is 6.02
Get precalculated fractions of proteins

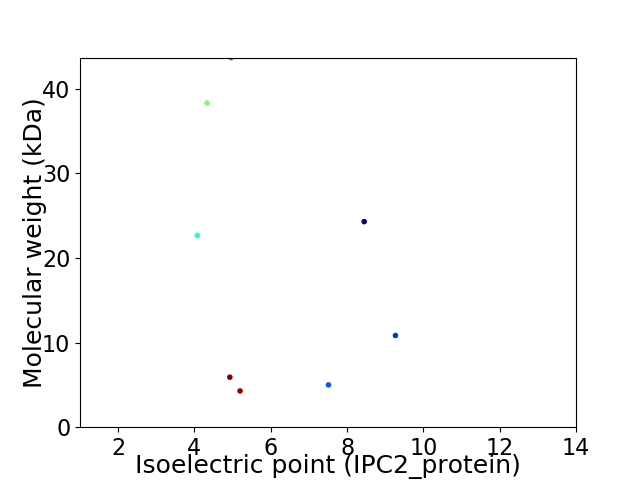
Virtual 2D-PAGE plot for 8 proteins (isoelectric point calculated using IPC2_protein)
Get csv file with sequences according to given criteria:
* You can choose from 21 different methods for calculating isoelectric point
Summary statistics related to proteome-wise predictions


Protein with the lowest isoelectric point:
>tr|W5S7M1|W5S7M1_9VIRU Protein D OS=Uncultured phage WW-nAnB strain 3 OX=1449897 PE=4 SV=1
MM1 pKa = 7.37MEE3 pKa = 4.65LPAIIKK9 pKa = 8.27TWVDD13 pKa = 3.69FDD15 pKa = 3.84GVTVYY20 pKa = 9.5TVQYY24 pKa = 10.39KK25 pKa = 10.69DD26 pKa = 4.21GSTCDD31 pKa = 3.44MTVQQYY37 pKa = 11.42DD38 pKa = 3.76YY39 pKa = 10.99LKK41 pKa = 11.05ASAQAVADD49 pKa = 3.83MDD51 pKa = 4.42SKK53 pKa = 11.62VSVDD57 pKa = 3.64SQPVEE62 pKa = 4.19TPVPAEE68 pKa = 3.56PAQNITEE75 pKa = 4.3SPDD78 pKa = 3.18LRR80 pKa = 11.84NGYY83 pKa = 9.35VPEE86 pKa = 4.03EE87 pKa = 4.13VEE89 pKa = 4.84LPFEE93 pKa = 4.74GSLTAYY99 pKa = 10.38DD100 pKa = 4.17DD101 pKa = 3.94RR102 pKa = 11.84AANTPALYY110 pKa = 10.8ANLPAVSNSFTAIMDD125 pKa = 3.72WFGDD129 pKa = 3.69TFFVEE134 pKa = 4.54RR135 pKa = 11.84TEE137 pKa = 4.44TVHH140 pKa = 6.82KK141 pKa = 10.29SGYY144 pKa = 6.93TSEE147 pKa = 4.33RR148 pKa = 11.84YY149 pKa = 9.6SYY151 pKa = 11.09NSSSQLIQLPYY162 pKa = 10.79EE163 pKa = 4.43EE164 pKa = 6.1DD165 pKa = 3.46STTTSQVLNPQACVSALLVVLVFITTVTWIKK196 pKa = 9.74NAIWGRR202 pKa = 11.84MSS204 pKa = 3.06
MM1 pKa = 7.37MEE3 pKa = 4.65LPAIIKK9 pKa = 8.27TWVDD13 pKa = 3.69FDD15 pKa = 3.84GVTVYY20 pKa = 9.5TVQYY24 pKa = 10.39KK25 pKa = 10.69DD26 pKa = 4.21GSTCDD31 pKa = 3.44MTVQQYY37 pKa = 11.42DD38 pKa = 3.76YY39 pKa = 10.99LKK41 pKa = 11.05ASAQAVADD49 pKa = 3.83MDD51 pKa = 4.42SKK53 pKa = 11.62VSVDD57 pKa = 3.64SQPVEE62 pKa = 4.19TPVPAEE68 pKa = 3.56PAQNITEE75 pKa = 4.3SPDD78 pKa = 3.18LRR80 pKa = 11.84NGYY83 pKa = 9.35VPEE86 pKa = 4.03EE87 pKa = 4.13VEE89 pKa = 4.84LPFEE93 pKa = 4.74GSLTAYY99 pKa = 10.38DD100 pKa = 4.17DD101 pKa = 3.94RR102 pKa = 11.84AANTPALYY110 pKa = 10.8ANLPAVSNSFTAIMDD125 pKa = 3.72WFGDD129 pKa = 3.69TFFVEE134 pKa = 4.54RR135 pKa = 11.84TEE137 pKa = 4.44TVHH140 pKa = 6.82KK141 pKa = 10.29SGYY144 pKa = 6.93TSEE147 pKa = 4.33RR148 pKa = 11.84YY149 pKa = 9.6SYY151 pKa = 11.09NSSSQLIQLPYY162 pKa = 10.79EE163 pKa = 4.43EE164 pKa = 6.1DD165 pKa = 3.46STTTSQVLNPQACVSALLVVLVFITTVTWIKK196 pKa = 9.74NAIWGRR202 pKa = 11.84MSS204 pKa = 3.06
Molecular weight: 22.66 kDa
Isoelectric point according different methods:
Protein with the highest isoelectric point:
>tr|W5S8E0|W5S8E0_9VIRU Protein G OS=Uncultured phage WW-nAnB strain 3 OX=1449897 PE=4 SV=1
MM1 pKa = 7.91RR2 pKa = 11.84SLSLALCMTSTLTATDD18 pKa = 3.14IFSEE22 pKa = 4.15LRR24 pKa = 11.84KK25 pKa = 10.66SNFLCSNPNFISYY38 pKa = 9.44GRR40 pKa = 11.84AVRR43 pKa = 11.84RR44 pKa = 11.84SHH46 pKa = 5.84MAGWCNGSTSRR57 pKa = 11.84SEE59 pKa = 4.16RR60 pKa = 11.84EE61 pKa = 4.16TVGSNPNPATKK72 pKa = 10.01TDD74 pKa = 3.4VTSVIRR80 pKa = 11.84CRR82 pKa = 11.84EE83 pKa = 3.82RR84 pKa = 11.84WWRR87 pKa = 11.84SEE89 pKa = 3.33KK90 pKa = 10.32KK91 pKa = 10.53AAVFLL96 pKa = 4.35
MM1 pKa = 7.91RR2 pKa = 11.84SLSLALCMTSTLTATDD18 pKa = 3.14IFSEE22 pKa = 4.15LRR24 pKa = 11.84KK25 pKa = 10.66SNFLCSNPNFISYY38 pKa = 9.44GRR40 pKa = 11.84AVRR43 pKa = 11.84RR44 pKa = 11.84SHH46 pKa = 5.84MAGWCNGSTSRR57 pKa = 11.84SEE59 pKa = 4.16RR60 pKa = 11.84EE61 pKa = 4.16TVGSNPNPATKK72 pKa = 10.01TDD74 pKa = 3.4VTSVIRR80 pKa = 11.84CRR82 pKa = 11.84EE83 pKa = 3.82RR84 pKa = 11.84WWRR87 pKa = 11.84SEE89 pKa = 3.33KK90 pKa = 10.32KK91 pKa = 10.53AAVFLL96 pKa = 4.35
Molecular weight: 10.84 kDa
Isoelectric point according different methods:
Peptides (in silico digests for buttom-up proteomics)
Below you can find in silico digests of the whole proteome with Trypsin, Chymotrypsin, Trypsin+LysC, LysN, ArgC proteases suitable for different mass spec machines.| Try ESI |
 |
|---|
| ChTry ESI |
 |
|---|
| ArgC ESI |
 |
|---|
| LysN ESI |
 |
|---|
| TryLysC ESI |
 |
|---|
| Try MALDI |
 |
|---|
| ChTry MALDI |
 |
|---|
| ArgC MALDI |
 |
|---|
| LysN MALDI |
 |
|---|
| TryLysC MALDI |
 |
|---|
| Try LTQ |
 |
|---|
| ChTry LTQ |
 |
|---|
| ArgC LTQ |
 |
|---|
| LysN LTQ |
 |
|---|
| TryLysC LTQ |
 |
|---|
| Try MSlow |
 |
|---|
| ChTry MSlow |
 |
|---|
| ArgC MSlow |
 |
|---|
| LysN MSlow |
 |
|---|
| TryLysC MSlow |
 |
|---|
| Try MShigh |
 |
|---|
| ChTry MShigh |
 |
|---|
| ArgC MShigh |
 |
|---|
| LysN MShigh |
 |
|---|
| TryLysC MShigh |
 |
|---|
General Statistics
Number of major isoforms |
Number of additional isoforms |
Number of all proteins |
Number of amino acids |
Min. Seq. Length |
Max. Seq. Length |
Avg. Seq. Length |
Avg. Mol. Weight |
|---|---|---|---|---|---|---|---|
0 |
1366 |
37 |
378 |
170.8 |
19.37 |
Amino acid frequency
Ala |
Cys |
Asp |
Glu |
Phe |
Gly |
His |
Ile |
Lys |
Leu |
|---|---|---|---|---|---|---|---|---|---|
5.564 ± 0.692 | 1.903 ± 0.512 |
6.296 ± 0.759 | 5.198 ± 0.871 |
6.442 ± 0.98 | 5.49 ± 0.625 |
1.391 ± 0.298 | 4.978 ± 0.772 |
4.173 ± 1.081 | 9.883 ± 1.003 |
Met |
Asn |
Gln |
Pro |
Arg |
Ser |
Thr |
Val |
Trp |
Tyr |
|---|---|---|---|---|---|---|---|---|---|
2.196 ± 0.518 | 3.88 ± 0.369 |
4.685 ± 0.46 | 2.928 ± 0.459 |
4.758 ± 0.829 | 11.054 ± 1.787 |
5.051 ± 1.009 | 7.101 ± 0.824 |
2.123 ± 0.207 | 4.905 ± 0.564 |
Most of the basic statistics you can see at this page can be downloaded from this CSV file
Proteome-pI is available under Creative Commons Attribution-NoDerivs license, for more details see here
| Reference: Kozlowski LP. Proteome-pI 2.0: Proteome Isoelectric Point Database Update. Nucleic Acids Res. 2021, doi: 10.1093/nar/gkab944 | Contact: Lukasz P. Kozlowski |
