candidate division MSBL1 archaeon SCGC-AAA259A05
Taxonomy: cellular organisms; Archaea; Euryarchaeota; Euryarchaeota incertae sedis; candidate division MSBL1
Average proteome isoelectric point is 6.22
Get precalculated fractions of proteins

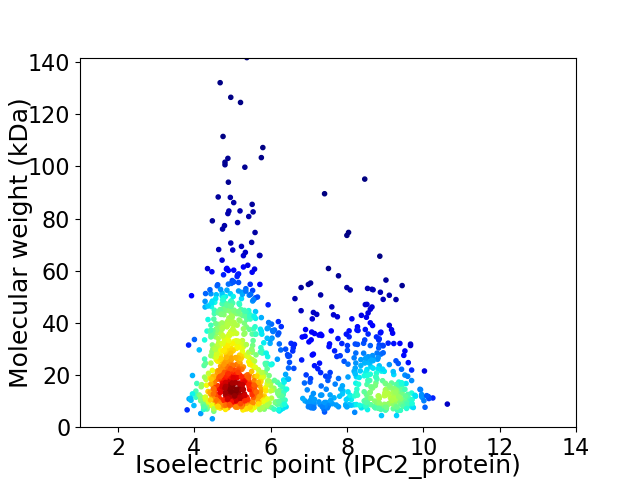
Virtual 2D-PAGE plot for 1212 proteins (isoelectric point calculated using IPC2_protein)
Get csv file with sequences according to given criteria:
* You can choose from 21 different methods for calculating isoelectric point
Summary statistics related to proteome-wise predictions


Protein with the lowest isoelectric point:
>tr|A0A133U380|A0A133U380_9EURY Uncharacterized protein OS=candidate division MSBL1 archaeon SCGC-AAA259A05 OX=1698259 GN=AKJ57_06550 PE=4 SV=1
MM1 pKa = 8.12DD2 pKa = 4.01ISGNISDD9 pKa = 3.97STEE12 pKa = 3.87QYY14 pKa = 11.1SGVPASNLSLAEE26 pKa = 4.1NKK28 pKa = 10.29SVTASSNEE36 pKa = 3.74NHH38 pKa = 6.03TEE40 pKa = 3.74WYY42 pKa = 9.62SGYY45 pKa = 9.75PSYY48 pKa = 11.32FNDD51 pKa = 3.67GKK53 pKa = 11.23LSTRR57 pKa = 11.84WSSKK61 pKa = 9.39YY62 pKa = 10.58SSPQWIYY69 pKa = 11.33VDD71 pKa = 4.16LGSPRR76 pKa = 11.84TFDD79 pKa = 2.8QVVIHH84 pKa = 6.44WEE86 pKa = 3.43AAYY89 pKa = 10.49GEE91 pKa = 4.3NYY93 pKa = 9.55EE94 pKa = 4.23IQVSDD99 pKa = 4.62GASEE103 pKa = 4.15WTTVTAVNNGDD114 pKa = 3.73GGTDD118 pKa = 2.77ILTFPATEE126 pKa = 3.46ARR128 pKa = 11.84YY129 pKa = 9.76IRR131 pKa = 11.84MYY133 pKa = 11.1GEE135 pKa = 4.17ARR137 pKa = 11.84GTQYY141 pKa = 11.18GYY143 pKa = 10.37SIKK146 pKa = 10.42EE147 pKa = 3.78FEE149 pKa = 4.44VYY151 pKa = 10.67LINEE155 pKa = 4.7PPTADD160 pKa = 3.15ADD162 pKa = 3.87GPYY165 pKa = 10.14EE166 pKa = 4.06VEE168 pKa = 3.66EE169 pKa = 4.68GEE171 pKa = 4.36NIKK174 pKa = 10.84LDD176 pKa = 3.84GTGSSDD182 pKa = 3.69PDD184 pKa = 3.99GDD186 pKa = 3.99SLSYY190 pKa = 10.8SWTITNDD197 pKa = 3.34PTGEE201 pKa = 3.93ASLADD206 pKa = 4.02AEE208 pKa = 4.79TEE210 pKa = 4.14NPTLQAPSVGSGTDD224 pKa = 2.94IEE226 pKa = 4.6VQLTVDD232 pKa = 4.38DD233 pKa = 4.27GHH235 pKa = 7.04GNTDD239 pKa = 3.01TDD241 pKa = 3.93TATVTVQNVPEE252 pKa = 4.69EE253 pKa = 4.37GFPWTTVAVVVIVIIVILIVGIWLRR278 pKa = 11.84QSGQLASEE286 pKa = 4.69GSGKK290 pKa = 10.55SSS292 pKa = 2.98
MM1 pKa = 8.12DD2 pKa = 4.01ISGNISDD9 pKa = 3.97STEE12 pKa = 3.87QYY14 pKa = 11.1SGVPASNLSLAEE26 pKa = 4.1NKK28 pKa = 10.29SVTASSNEE36 pKa = 3.74NHH38 pKa = 6.03TEE40 pKa = 3.74WYY42 pKa = 9.62SGYY45 pKa = 9.75PSYY48 pKa = 11.32FNDD51 pKa = 3.67GKK53 pKa = 11.23LSTRR57 pKa = 11.84WSSKK61 pKa = 9.39YY62 pKa = 10.58SSPQWIYY69 pKa = 11.33VDD71 pKa = 4.16LGSPRR76 pKa = 11.84TFDD79 pKa = 2.8QVVIHH84 pKa = 6.44WEE86 pKa = 3.43AAYY89 pKa = 10.49GEE91 pKa = 4.3NYY93 pKa = 9.55EE94 pKa = 4.23IQVSDD99 pKa = 4.62GASEE103 pKa = 4.15WTTVTAVNNGDD114 pKa = 3.73GGTDD118 pKa = 2.77ILTFPATEE126 pKa = 3.46ARR128 pKa = 11.84YY129 pKa = 9.76IRR131 pKa = 11.84MYY133 pKa = 11.1GEE135 pKa = 4.17ARR137 pKa = 11.84GTQYY141 pKa = 11.18GYY143 pKa = 10.37SIKK146 pKa = 10.42EE147 pKa = 3.78FEE149 pKa = 4.44VYY151 pKa = 10.67LINEE155 pKa = 4.7PPTADD160 pKa = 3.15ADD162 pKa = 3.87GPYY165 pKa = 10.14EE166 pKa = 4.06VEE168 pKa = 3.66EE169 pKa = 4.68GEE171 pKa = 4.36NIKK174 pKa = 10.84LDD176 pKa = 3.84GTGSSDD182 pKa = 3.69PDD184 pKa = 3.99GDD186 pKa = 3.99SLSYY190 pKa = 10.8SWTITNDD197 pKa = 3.34PTGEE201 pKa = 3.93ASLADD206 pKa = 4.02AEE208 pKa = 4.79TEE210 pKa = 4.14NPTLQAPSVGSGTDD224 pKa = 2.94IEE226 pKa = 4.6VQLTVDD232 pKa = 4.38DD233 pKa = 4.27GHH235 pKa = 7.04GNTDD239 pKa = 3.01TDD241 pKa = 3.93TATVTVQNVPEE252 pKa = 4.69EE253 pKa = 4.37GFPWTTVAVVVIVIIVILIVGIWLRR278 pKa = 11.84QSGQLASEE286 pKa = 4.69GSGKK290 pKa = 10.55SSS292 pKa = 2.98
Molecular weight: 31.49 kDa
Isoelectric point according different methods:
Protein with the highest isoelectric point:
>tr|A0A133U460|A0A133U460_9EURY DNA ligase (Fragment) OS=candidate division MSBL1 archaeon SCGC-AAA259A05 OX=1698259 GN=AKJ57_06015 PE=3 SV=1
MM1 pKa = 7.36ARR3 pKa = 11.84KK4 pKa = 9.78SSLKK8 pKa = 10.35KK9 pKa = 9.32IALEE13 pKa = 3.89RR14 pKa = 11.84VEE16 pKa = 4.85RR17 pKa = 11.84LLDD20 pKa = 3.66FASSIFKK27 pKa = 10.35RR28 pKa = 11.84RR29 pKa = 11.84PDD31 pKa = 3.28LAHH34 pKa = 7.48RR35 pKa = 11.84YY36 pKa = 9.84AEE38 pKa = 4.3LAWKK42 pKa = 10.23IKK44 pKa = 9.89IRR46 pKa = 11.84YY47 pKa = 7.54NLRR50 pKa = 11.84LPRR53 pKa = 11.84RR54 pKa = 11.84LKK56 pKa = 10.6RR57 pKa = 11.84KK58 pKa = 9.21FCRR61 pKa = 11.84KK62 pKa = 9.14CQSFWVPGEE71 pKa = 4.0TCRR74 pKa = 11.84VRR76 pKa = 11.84LRR78 pKa = 11.84PSSPPHH84 pKa = 6.23IAITCLKK91 pKa = 8.88CGHH94 pKa = 5.76VQRR97 pKa = 11.84IPYY100 pKa = 9.85EE101 pKa = 4.0EE102 pKa = 3.97
MM1 pKa = 7.36ARR3 pKa = 11.84KK4 pKa = 9.78SSLKK8 pKa = 10.35KK9 pKa = 9.32IALEE13 pKa = 3.89RR14 pKa = 11.84VEE16 pKa = 4.85RR17 pKa = 11.84LLDD20 pKa = 3.66FASSIFKK27 pKa = 10.35RR28 pKa = 11.84RR29 pKa = 11.84PDD31 pKa = 3.28LAHH34 pKa = 7.48RR35 pKa = 11.84YY36 pKa = 9.84AEE38 pKa = 4.3LAWKK42 pKa = 10.23IKK44 pKa = 9.89IRR46 pKa = 11.84YY47 pKa = 7.54NLRR50 pKa = 11.84LPRR53 pKa = 11.84RR54 pKa = 11.84LKK56 pKa = 10.6RR57 pKa = 11.84KK58 pKa = 9.21FCRR61 pKa = 11.84KK62 pKa = 9.14CQSFWVPGEE71 pKa = 4.0TCRR74 pKa = 11.84VRR76 pKa = 11.84LRR78 pKa = 11.84PSSPPHH84 pKa = 6.23IAITCLKK91 pKa = 8.88CGHH94 pKa = 5.76VQRR97 pKa = 11.84IPYY100 pKa = 9.85EE101 pKa = 4.0EE102 pKa = 3.97
Molecular weight: 12.22 kDa
Isoelectric point according different methods:
Peptides (in silico digests for buttom-up proteomics)
Below you can find in silico digests of the whole proteome with Trypsin, Chymotrypsin, Trypsin+LysC, LysN, ArgC proteases suitable for different mass spec machines.| Try ESI |
 |
|---|
| ChTry ESI |
 |
|---|
| ArgC ESI |
 |
|---|
| LysN ESI |
 |
|---|
| TryLysC ESI |
 |
|---|
| Try MALDI |
 |
|---|
| ChTry MALDI |
 |
|---|
| ArgC MALDI |
 |
|---|
| LysN MALDI |
 |
|---|
| TryLysC MALDI |
 |
|---|
| Try LTQ |
 |
|---|
| ChTry LTQ |
 |
|---|
| ArgC LTQ |
 |
|---|
| LysN LTQ |
 |
|---|
| TryLysC LTQ |
 |
|---|
| Try MSlow |
 |
|---|
| ChTry MSlow |
 |
|---|
| ArgC MSlow |
 |
|---|
| LysN MSlow |
 |
|---|
| TryLysC MSlow |
 |
|---|
| Try MShigh |
 |
|---|
| ChTry MShigh |
 |
|---|
| ArgC MShigh |
 |
|---|
| LysN MShigh |
 |
|---|
| TryLysC MShigh |
 |
|---|
General Statistics
Number of major isoforms |
Number of additional isoforms |
Number of all proteins |
Number of amino acids |
Min. Seq. Length |
Max. Seq. Length |
Avg. Seq. Length |
Avg. Mol. Weight |
|---|---|---|---|---|---|---|---|
0 |
270658 |
29 |
1259 |
223.3 |
25.11 |
Amino acid frequency
Ala |
Cys |
Asp |
Glu |
Phe |
Gly |
His |
Ile |
Lys |
Leu |
|---|---|---|---|---|---|---|---|---|---|
6.333 ± 0.078 | 1.04 ± 0.03 |
5.593 ± 0.051 | 10.234 ± 0.103 |
3.891 ± 0.055 | 7.698 ± 0.066 |
1.708 ± 0.031 | 6.632 ± 0.067 |
7.211 ± 0.086 | 9.312 ± 0.073 |
Met |
Asn |
Gln |
Pro |
Arg |
Ser |
Thr |
Val |
Trp |
Tyr |
|---|---|---|---|---|---|---|---|---|---|
2.241 ± 0.034 | 3.568 ± 0.046 |
4.159 ± 0.049 | 2.16 ± 0.032 |
5.974 ± 0.074 | 6.558 ± 0.061 |
4.59 ± 0.046 | 6.999 ± 0.067 |
1.214 ± 0.032 | 2.886 ± 0.043 |
Most of the basic statistics you can see at this page can be downloaded from this CSV file
Proteome-pI is available under Creative Commons Attribution-NoDerivs license, for more details see here
| Reference: Kozlowski LP. Proteome-pI 2.0: Proteome Isoelectric Point Database Update. Nucleic Acids Res. 2021, doi: 10.1093/nar/gkab944 | Contact: Lukasz P. Kozlowski |
