Fowl adenovirus C serotype 10 (strain SA2) (FAdV-10) (Fowl adenovirus 10)
Taxonomy: Viruses; Varidnaviria; Bamfordvirae; Preplasmiviricota; Tectiliviricetes; Rowavirales; Adenoviridae; Aviadenovirus; Fowl aviadenovirus C
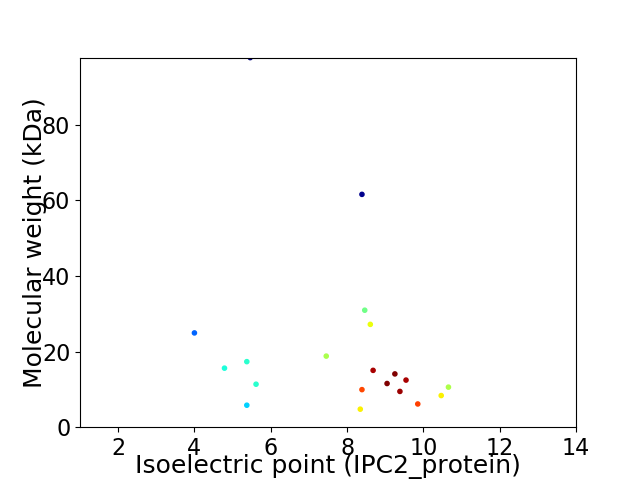
Average proteome isoelectric point is 7.63
Get precalculated fractions of proteins

Virtual 2D-PAGE plot for 20 proteins (isoelectric point calculated using IPC2_protein)
Get csv file with sequences according to given criteria:
* You can choose from 21 different methods for calculating isoelectric point
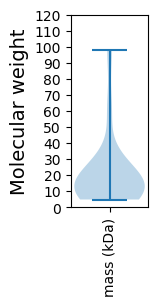
Summary statistics related to proteome-wise predictions


Protein with the lowest isoelectric point:
>tr|A0A6M6R219|A0A6M6R219_ADEGX ORF47 OS=Fowl adenovirus C serotype 10 (strain SA2) OX=10547 PE=4 SV=1
MM1 pKa = 8.07AEE3 pKa = 3.44EE4 pKa = 4.28WLDD7 pKa = 3.66LFHH10 pKa = 7.59PSTSPNPEE18 pKa = 3.77GEE20 pKa = 4.37GEE22 pKa = 4.17DD23 pKa = 3.38MSLEE27 pKa = 4.49TEE29 pKa = 4.17CHH31 pKa = 6.44APLQYY36 pKa = 10.85ISMLSFDD43 pKa = 5.25DD44 pKa = 4.26LLAAAGPPEE53 pKa = 4.17YY54 pKa = 10.63SPEE57 pKa = 4.15EE58 pKa = 4.03NQEE61 pKa = 4.13TPPLEE66 pKa = 4.43TIEE69 pKa = 4.63VGDD72 pKa = 3.65IMAEE76 pKa = 3.72LGIPIEE82 pKa = 4.72GPPTSPSDD90 pKa = 3.52SSSSLDD96 pKa = 3.3SVLFSGVDD104 pKa = 3.83LYY106 pKa = 11.61DD107 pKa = 3.97LDD109 pKa = 3.96YY110 pKa = 10.96TIVFSRR116 pKa = 11.84LRR118 pKa = 11.84EE119 pKa = 3.9FWQSHH124 pKa = 4.12GAYY127 pKa = 9.28LKK129 pKa = 9.53TVASLEE135 pKa = 4.04CMQNDD140 pKa = 3.53RR141 pKa = 11.84KK142 pKa = 10.15FQEE145 pKa = 4.95AYY147 pKa = 9.4CSLVRR152 pKa = 11.84MHH154 pKa = 6.99AVSEE158 pKa = 4.2DD159 pKa = 3.47AKK161 pKa = 10.72EE162 pKa = 4.03HH163 pKa = 6.31LNEE166 pKa = 4.65LLLDD170 pKa = 3.62EE171 pKa = 5.09TNYY174 pKa = 8.96QHH176 pKa = 7.46CEE178 pKa = 3.96PLNDD182 pKa = 3.65MLDD185 pKa = 3.71LGFRR189 pKa = 11.84WLNDD193 pKa = 3.39LKK195 pKa = 11.31GGMEE199 pKa = 4.0WCMDD203 pKa = 3.71TALDD207 pKa = 3.88RR208 pKa = 11.84ASKK211 pKa = 10.65VMPLTDD217 pKa = 3.67YY218 pKa = 11.04QPQQ221 pKa = 3.17
MM1 pKa = 8.07AEE3 pKa = 3.44EE4 pKa = 4.28WLDD7 pKa = 3.66LFHH10 pKa = 7.59PSTSPNPEE18 pKa = 3.77GEE20 pKa = 4.37GEE22 pKa = 4.17DD23 pKa = 3.38MSLEE27 pKa = 4.49TEE29 pKa = 4.17CHH31 pKa = 6.44APLQYY36 pKa = 10.85ISMLSFDD43 pKa = 5.25DD44 pKa = 4.26LLAAAGPPEE53 pKa = 4.17YY54 pKa = 10.63SPEE57 pKa = 4.15EE58 pKa = 4.03NQEE61 pKa = 4.13TPPLEE66 pKa = 4.43TIEE69 pKa = 4.63VGDD72 pKa = 3.65IMAEE76 pKa = 3.72LGIPIEE82 pKa = 4.72GPPTSPSDD90 pKa = 3.52SSSSLDD96 pKa = 3.3SVLFSGVDD104 pKa = 3.83LYY106 pKa = 11.61DD107 pKa = 3.97LDD109 pKa = 3.96YY110 pKa = 10.96TIVFSRR116 pKa = 11.84LRR118 pKa = 11.84EE119 pKa = 3.9FWQSHH124 pKa = 4.12GAYY127 pKa = 9.28LKK129 pKa = 9.53TVASLEE135 pKa = 4.04CMQNDD140 pKa = 3.53RR141 pKa = 11.84KK142 pKa = 10.15FQEE145 pKa = 4.95AYY147 pKa = 9.4CSLVRR152 pKa = 11.84MHH154 pKa = 6.99AVSEE158 pKa = 4.2DD159 pKa = 3.47AKK161 pKa = 10.72EE162 pKa = 4.03HH163 pKa = 6.31LNEE166 pKa = 4.65LLLDD170 pKa = 3.62EE171 pKa = 5.09TNYY174 pKa = 8.96QHH176 pKa = 7.46CEE178 pKa = 3.96PLNDD182 pKa = 3.65MLDD185 pKa = 3.71LGFRR189 pKa = 11.84WLNDD193 pKa = 3.39LKK195 pKa = 11.31GGMEE199 pKa = 4.0WCMDD203 pKa = 3.71TALDD207 pKa = 3.88RR208 pKa = 11.84ASKK211 pKa = 10.65VMPLTDD217 pKa = 3.67YY218 pKa = 11.04QPQQ221 pKa = 3.17
Molecular weight: 24.93 kDa
Isoelectric point according different methods:
Protein with the highest isoelectric point:
>tr|A0A6M6R3F2|A0A6M6R3F2_ADEGX ORF31 OS=Fowl adenovirus C serotype 10 (strain SA2) OX=10547 PE=4 SV=1
MM1 pKa = 7.65SILNPLPLPPLPLQPLLPLPLQPLLPLPLQPLQPLLPLPLQPLLPLPLQPLQPLLPLPLQPLLPLRR67 pKa = 11.84PPPNQSQNRR76 pKa = 11.84APLVMKK82 pKa = 10.46KK83 pKa = 10.22KK84 pKa = 9.8MKK86 pKa = 10.25IVGSKK91 pKa = 10.51NIAIRR96 pKa = 3.6
MM1 pKa = 7.65SILNPLPLPPLPLQPLLPLPLQPLLPLPLQPLQPLLPLPLQPLLPLPLQPLQPLLPLPLQPLLPLRR67 pKa = 11.84PPPNQSQNRR76 pKa = 11.84APLVMKK82 pKa = 10.46KK83 pKa = 10.22KK84 pKa = 9.8MKK86 pKa = 10.25IVGSKK91 pKa = 10.51NIAIRR96 pKa = 3.6
Molecular weight: 10.6 kDa
Isoelectric point according different methods:
Peptides (in silico digests for buttom-up proteomics)
Below you can find in silico digests of the whole proteome with Trypsin, Chymotrypsin, Trypsin+LysC, LysN, ArgC proteases suitable for different mass spec machines.| Try ESI |
 |
|---|
| ChTry ESI |
 |
|---|
| ArgC ESI |
 |
|---|
| LysN ESI |
 |
|---|
| TryLysC ESI |
 |
|---|
| Try MALDI |
 |
|---|
| ChTry MALDI |
 |
|---|
| ArgC MALDI |
 |
|---|
| LysN MALDI |
 |
|---|
| TryLysC MALDI |
 |
|---|
| Try LTQ |
 |
|---|
| ChTry LTQ |
 |
|---|
| ArgC LTQ |
 |
|---|
| LysN LTQ |
 |
|---|
| TryLysC LTQ |
 |
|---|
| Try MSlow |
 |
|---|
| ChTry MSlow |
 |
|---|
| ArgC MSlow |
 |
|---|
| LysN MSlow |
 |
|---|
| TryLysC MSlow |
 |
|---|
| Try MShigh |
 |
|---|
| ChTry MShigh |
 |
|---|
| ArgC MShigh |
 |
|---|
| LysN MShigh |
 |
|---|
| TryLysC MShigh |
 |
|---|
General Statistics
Number of major isoforms |
Number of additional isoforms |
Number of all proteins |
Number of amino acids |
Min. Seq. Length |
Max. Seq. Length |
Avg. Seq. Length |
Avg. Mol. Weight |
|---|---|---|---|---|---|---|---|
0 |
3652 |
45 |
869 |
182.6 |
20.69 |
Amino acid frequency
Ala |
Cys |
Asp |
Glu |
Phe |
Gly |
His |
Ile |
Lys |
Leu |
|---|---|---|---|---|---|---|---|---|---|
5.422 ± 0.399 | 2.547 ± 0.472 |
4.244 ± 0.458 | 5.394 ± 0.524 |
4.381 ± 0.291 | 5.887 ± 0.426 |
3.286 ± 0.287 | 4.409 ± 0.372 |
4.299 ± 0.32 | 9.392 ± 0.95 |
Met |
Asn |
Gln |
Pro |
Arg |
Ser |
Thr |
Val |
Trp |
Tyr |
|---|---|---|---|---|---|---|---|---|---|
3.176 ± 0.312 | 3.149 ± 0.331 |
7.393 ± 0.889 | 3.423 ± 0.377 |
6.106 ± 0.657 | 7.694 ± 0.928 |
7.64 ± 1.608 | 6.407 ± 0.681 |
1.78 ± 0.186 | 3.97 ± 0.346 |
Most of the basic statistics you can see at this page can be downloaded from this CSV file
Proteome-pI is available under Creative Commons Attribution-NoDerivs license, for more details see here
| Reference: Kozlowski LP. Proteome-pI 2.0: Proteome Isoelectric Point Database Update. Nucleic Acids Res. 2021, doi: 10.1093/nar/gkab944 | Contact: Lukasz P. Kozlowski |
