Mycoplasma equirhinis
Taxonomy: cellular organisms; Bacteria; Terrabacteria group; Tenericutes; Mollicutes; Mycoplasmatales; Mycoplasmataceae; Mycoplasma
Average proteome isoelectric point is 7.38
Get precalculated fractions of proteins

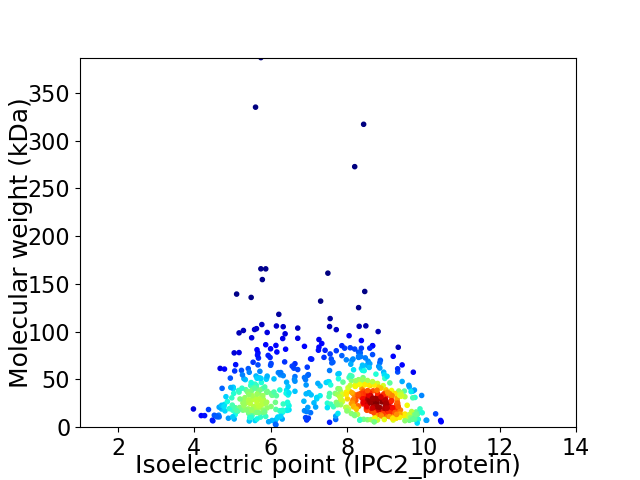
Virtual 2D-PAGE plot for 613 proteins (isoelectric point calculated using IPC2_protein)
Get csv file with sequences according to given criteria:
* You can choose from 21 different methods for calculating isoelectric point
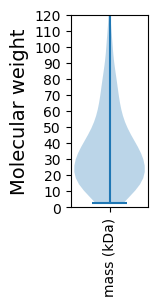
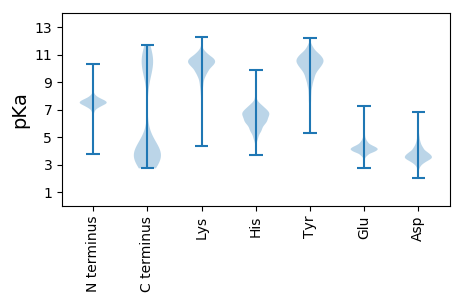
Summary statistics related to proteome-wise predictions


Protein with the lowest isoelectric point:
>tr|A0A501SBM4|A0A501SBM4_9MOLU Site-specific integrase (Fragment) OS=Mycoplasma equirhinis OX=92402 GN=FJM08_03400 PE=4 SV=1
VV1 pKa = 6.91NNPEE5 pKa = 4.13QFWDD9 pKa = 3.89LLCAGRR15 pKa = 11.84SGIVRR20 pKa = 11.84VPAQRR25 pKa = 11.84WDD27 pKa = 3.14ADD29 pKa = 3.21AYY31 pKa = 10.83YY32 pKa = 10.47CDD34 pKa = 4.12DD35 pKa = 3.59HH36 pKa = 6.69TVPGTICSTEE46 pKa = 3.92GGFLTSWQPDD56 pKa = 3.21EE57 pKa = 4.8FDD59 pKa = 4.73AEE61 pKa = 4.45FFSIPPRR68 pKa = 11.84EE69 pKa = 4.16AAAMDD74 pKa = 3.63PQQRR78 pKa = 11.84LFIEE82 pKa = 4.66VAWDD86 pKa = 3.33ALDD89 pKa = 3.63YY90 pKa = 11.49AGVPQHH96 pKa = 6.54TIRR99 pKa = 11.84GTQTSVFVGVTAYY112 pKa = 10.77DD113 pKa = 3.52YY114 pKa = 10.72MLTLAGRR121 pKa = 11.84LRR123 pKa = 11.84PVDD126 pKa = 4.09LDD128 pKa = 3.86AYY130 pKa = 9.93IPTGNSANFAAGRR143 pKa = 11.84LAYY146 pKa = 9.58ILGARR151 pKa = 11.84GPAVVIDD158 pKa = 4.19TACSSSLVAVHH169 pKa = 6.79LL170 pKa = 4.33
VV1 pKa = 6.91NNPEE5 pKa = 4.13QFWDD9 pKa = 3.89LLCAGRR15 pKa = 11.84SGIVRR20 pKa = 11.84VPAQRR25 pKa = 11.84WDD27 pKa = 3.14ADD29 pKa = 3.21AYY31 pKa = 10.83YY32 pKa = 10.47CDD34 pKa = 4.12DD35 pKa = 3.59HH36 pKa = 6.69TVPGTICSTEE46 pKa = 3.92GGFLTSWQPDD56 pKa = 3.21EE57 pKa = 4.8FDD59 pKa = 4.73AEE61 pKa = 4.45FFSIPPRR68 pKa = 11.84EE69 pKa = 4.16AAAMDD74 pKa = 3.63PQQRR78 pKa = 11.84LFIEE82 pKa = 4.66VAWDD86 pKa = 3.33ALDD89 pKa = 3.63YY90 pKa = 11.49AGVPQHH96 pKa = 6.54TIRR99 pKa = 11.84GTQTSVFVGVTAYY112 pKa = 10.77DD113 pKa = 3.52YY114 pKa = 10.72MLTLAGRR121 pKa = 11.84LRR123 pKa = 11.84PVDD126 pKa = 4.09LDD128 pKa = 3.86AYY130 pKa = 9.93IPTGNSANFAAGRR143 pKa = 11.84LAYY146 pKa = 9.58ILGARR151 pKa = 11.84GPAVVIDD158 pKa = 4.19TACSSSLVAVHH169 pKa = 6.79LL170 pKa = 4.33
Molecular weight: 18.5 kDa
Isoelectric point according different methods:
Protein with the highest isoelectric point:
>tr|A0A501SP70|A0A501SP70_9MOLU Leucyl aminopeptidase family protein OS=Mycoplasma equirhinis OX=92402 GN=FJM08_01160 PE=3 SV=1
MM1 pKa = 7.54AKK3 pKa = 9.93SSKK6 pKa = 9.85RR7 pKa = 11.84RR8 pKa = 11.84PAPEE12 pKa = 4.13KK13 pKa = 9.63PVKK16 pKa = 9.16TRR18 pKa = 11.84KK19 pKa = 9.67CVFCAKK25 pKa = 9.82KK26 pKa = 10.56DD27 pKa = 3.53QAIDD31 pKa = 3.74YY32 pKa = 10.18KK33 pKa = 10.75DD34 pKa = 3.25TALLRR39 pKa = 11.84TYY41 pKa = 10.13ISEE44 pKa = 4.05RR45 pKa = 11.84GKK47 pKa = 9.89IRR49 pKa = 11.84ARR51 pKa = 11.84RR52 pKa = 11.84VTGNCVQHH60 pKa = 6.07QRR62 pKa = 11.84DD63 pKa = 3.18IALAVTNARR72 pKa = 3.98
MM1 pKa = 7.54AKK3 pKa = 9.93SSKK6 pKa = 9.85RR7 pKa = 11.84RR8 pKa = 11.84PAPEE12 pKa = 4.13KK13 pKa = 9.63PVKK16 pKa = 9.16TRR18 pKa = 11.84KK19 pKa = 9.67CVFCAKK25 pKa = 9.82KK26 pKa = 10.56DD27 pKa = 3.53QAIDD31 pKa = 3.74YY32 pKa = 10.18KK33 pKa = 10.75DD34 pKa = 3.25TALLRR39 pKa = 11.84TYY41 pKa = 10.13ISEE44 pKa = 4.05RR45 pKa = 11.84GKK47 pKa = 9.89IRR49 pKa = 11.84ARR51 pKa = 11.84RR52 pKa = 11.84VTGNCVQHH60 pKa = 6.07QRR62 pKa = 11.84DD63 pKa = 3.18IALAVTNARR72 pKa = 3.98
Molecular weight: 8.22 kDa
Isoelectric point according different methods:
Peptides (in silico digests for buttom-up proteomics)
Below you can find in silico digests of the whole proteome with Trypsin, Chymotrypsin, Trypsin+LysC, LysN, ArgC proteases suitable for different mass spec machines.| Try ESI |
 |
|---|
| ChTry ESI |
 |
|---|
| ArgC ESI |
 |
|---|
| LysN ESI |
 |
|---|
| TryLysC ESI |
 |
|---|
| Try MALDI |
 |
|---|
| ChTry MALDI |
 |
|---|
| ArgC MALDI |
 |
|---|
| LysN MALDI |
 |
|---|
| TryLysC MALDI |
 |
|---|
| Try LTQ |
 |
|---|
| ChTry LTQ |
 |
|---|
| ArgC LTQ |
 |
|---|
| LysN LTQ |
 |
|---|
| TryLysC LTQ |
 |
|---|
| Try MSlow |
 |
|---|
| ChTry MSlow |
 |
|---|
| ArgC MSlow |
 |
|---|
| LysN MSlow |
 |
|---|
| TryLysC MSlow |
 |
|---|
| Try MShigh |
 |
|---|
| ChTry MShigh |
 |
|---|
| ArgC MShigh |
 |
|---|
| LysN MShigh |
 |
|---|
| TryLysC MShigh |
 |
|---|
General Statistics
Number of major isoforms |
Number of additional isoforms |
Number of all proteins |
Number of amino acids |
Min. Seq. Length |
Max. Seq. Length |
Avg. Seq. Length |
Avg. Mol. Weight |
|---|---|---|---|---|---|---|---|
0 |
212910 |
24 |
3395 |
347.3 |
39.75 |
Amino acid frequency
Ala |
Cys |
Asp |
Glu |
Phe |
Gly |
His |
Ile |
Lys |
Leu |
|---|---|---|---|---|---|---|---|---|---|
5.909 ± 0.12 | 0.645 ± 0.032 |
5.339 ± 0.087 | 7.113 ± 0.129 |
5.293 ± 0.111 | 4.678 ± 0.097 |
1.448 ± 0.042 | 10.044 ± 0.123 |
10.529 ± 0.162 | 9.468 ± 0.086 |
Met |
Asn |
Gln |
Pro |
Arg |
Ser |
Thr |
Val |
Trp |
Tyr |
|---|---|---|---|---|---|---|---|---|---|
1.75 ± 0.049 | 7.785 ± 0.113 |
2.668 ± 0.074 | 3.059 ± 0.049 |
3.042 ± 0.079 | 6.449 ± 0.063 |
4.938 ± 0.064 | 4.92 ± 0.09 |
0.903 ± 0.033 | 4.019 ± 0.067 |
Most of the basic statistics you can see at this page can be downloaded from this CSV file
Proteome-pI is available under Creative Commons Attribution-NoDerivs license, for more details see here
| Reference: Kozlowski LP. Proteome-pI 2.0: Proteome Isoelectric Point Database Update. Nucleic Acids Res. 2021, doi: 10.1093/nar/gkab944 | Contact: Lukasz P. Kozlowski |
