CRESS virus sp. ctczB4
Taxonomy: Viruses; Monodnaviria; Shotokuvirae; Cressdnaviricota; unclassified Cressdnaviricota; CRESS viruses
Average proteome isoelectric point is 8.86
Get precalculated fractions of proteins

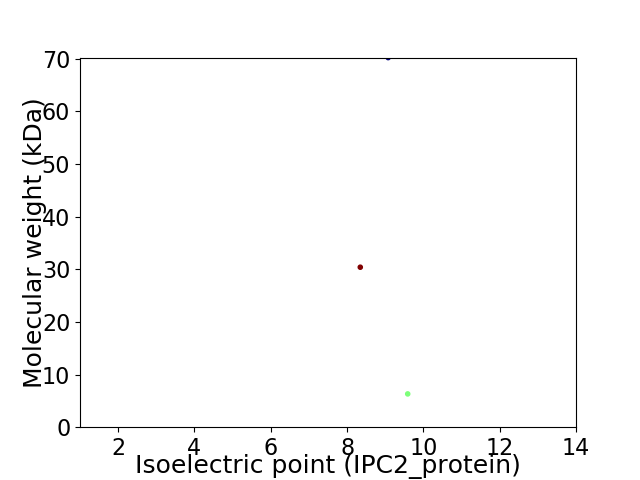
Virtual 2D-PAGE plot for 3 proteins (isoelectric point calculated using IPC2_protein)
Get csv file with sequences according to given criteria:
* You can choose from 21 different methods for calculating isoelectric point
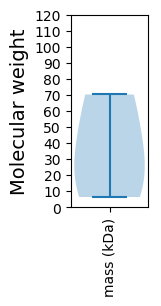
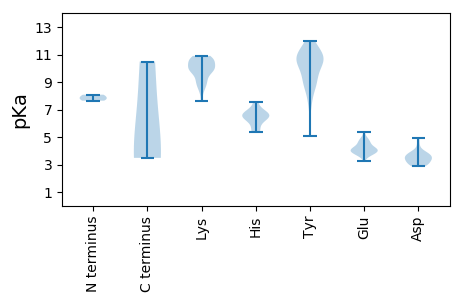
Summary statistics related to proteome-wise predictions


Protein with the lowest isoelectric point:
>tr|A0A5Q2W9F2|A0A5Q2W9F2_9VIRU Putative capsid protein OS=CRESS virus sp. ctczB4 OX=2656682 PE=4 SV=1
MM1 pKa = 7.64SNGQGIFWLLTIPHH15 pKa = 6.42YY16 pKa = 11.16GFTPYY21 pKa = 10.6LPPGCSWIKK30 pKa = 10.04GQLEE34 pKa = 3.92RR35 pKa = 11.84GEE37 pKa = 4.73GGFLHH42 pKa = 6.08WQIIVAFQSRR52 pKa = 11.84CRR54 pKa = 11.84LRR56 pKa = 11.84GVKK59 pKa = 10.02QIFGSEE65 pKa = 3.99AHH67 pKa = 6.61CEE69 pKa = 4.07LSRR72 pKa = 11.84SAAANEE78 pKa = 4.32YY79 pKa = 8.84VWKK82 pKa = 9.72EE83 pKa = 3.75QTRR86 pKa = 11.84VEE88 pKa = 4.18GTPFEE93 pKa = 5.35LGAKK97 pKa = 9.26PIRR100 pKa = 11.84RR101 pKa = 11.84NSQTDD106 pKa = 3.33WEE108 pKa = 4.98SVWTAAKK115 pKa = 10.57SRR117 pKa = 11.84DD118 pKa = 3.61LEE120 pKa = 4.64AIPAHH125 pKa = 5.35TRR127 pKa = 11.84VLCFRR132 pKa = 11.84SILSIASYY140 pKa = 10.78FDD142 pKa = 3.0TAIAVEE148 pKa = 4.52RR149 pKa = 11.84SVQVYY154 pKa = 8.52WGRR157 pKa = 11.84TGTGKK162 pKa = 10.03SRR164 pKa = 11.84RR165 pKa = 11.84AWEE168 pKa = 3.92AAGVDD173 pKa = 4.54AYY175 pKa = 11.64SKK177 pKa = 10.73DD178 pKa = 3.51PRR180 pKa = 11.84SKK182 pKa = 9.96FWFGYY187 pKa = 9.13RR188 pKa = 11.84GQEE191 pKa = 3.24RR192 pKa = 11.84VVIDD196 pKa = 3.8EE197 pKa = 4.04FRR199 pKa = 11.84GGIDD203 pKa = 3.25VSHH206 pKa = 7.54LLRR209 pKa = 11.84WLDD212 pKa = 3.64RR213 pKa = 11.84YY214 pKa = 9.75PVLVEE219 pKa = 4.22LKK221 pKa = 10.42GSSVPLAARR230 pKa = 11.84EE231 pKa = 3.63IWITSNVDD239 pKa = 2.94PRR241 pKa = 11.84NWYY244 pKa = 8.99PDD246 pKa = 3.32LDD248 pKa = 3.99EE249 pKa = 4.5EE250 pKa = 4.83TRR252 pKa = 11.84CALIRR257 pKa = 11.84RR258 pKa = 11.84LSITHH263 pKa = 6.54FNN265 pKa = 3.55
MM1 pKa = 7.64SNGQGIFWLLTIPHH15 pKa = 6.42YY16 pKa = 11.16GFTPYY21 pKa = 10.6LPPGCSWIKK30 pKa = 10.04GQLEE34 pKa = 3.92RR35 pKa = 11.84GEE37 pKa = 4.73GGFLHH42 pKa = 6.08WQIIVAFQSRR52 pKa = 11.84CRR54 pKa = 11.84LRR56 pKa = 11.84GVKK59 pKa = 10.02QIFGSEE65 pKa = 3.99AHH67 pKa = 6.61CEE69 pKa = 4.07LSRR72 pKa = 11.84SAAANEE78 pKa = 4.32YY79 pKa = 8.84VWKK82 pKa = 9.72EE83 pKa = 3.75QTRR86 pKa = 11.84VEE88 pKa = 4.18GTPFEE93 pKa = 5.35LGAKK97 pKa = 9.26PIRR100 pKa = 11.84RR101 pKa = 11.84NSQTDD106 pKa = 3.33WEE108 pKa = 4.98SVWTAAKK115 pKa = 10.57SRR117 pKa = 11.84DD118 pKa = 3.61LEE120 pKa = 4.64AIPAHH125 pKa = 5.35TRR127 pKa = 11.84VLCFRR132 pKa = 11.84SILSIASYY140 pKa = 10.78FDD142 pKa = 3.0TAIAVEE148 pKa = 4.52RR149 pKa = 11.84SVQVYY154 pKa = 8.52WGRR157 pKa = 11.84TGTGKK162 pKa = 10.03SRR164 pKa = 11.84RR165 pKa = 11.84AWEE168 pKa = 3.92AAGVDD173 pKa = 4.54AYY175 pKa = 11.64SKK177 pKa = 10.73DD178 pKa = 3.51PRR180 pKa = 11.84SKK182 pKa = 9.96FWFGYY187 pKa = 9.13RR188 pKa = 11.84GQEE191 pKa = 3.24RR192 pKa = 11.84VVIDD196 pKa = 3.8EE197 pKa = 4.04FRR199 pKa = 11.84GGIDD203 pKa = 3.25VSHH206 pKa = 7.54LLRR209 pKa = 11.84WLDD212 pKa = 3.64RR213 pKa = 11.84YY214 pKa = 9.75PVLVEE219 pKa = 4.22LKK221 pKa = 10.42GSSVPLAARR230 pKa = 11.84EE231 pKa = 3.63IWITSNVDD239 pKa = 2.94PRR241 pKa = 11.84NWYY244 pKa = 8.99PDD246 pKa = 3.32LDD248 pKa = 3.99EE249 pKa = 4.5EE250 pKa = 4.83TRR252 pKa = 11.84CALIRR257 pKa = 11.84RR258 pKa = 11.84LSITHH263 pKa = 6.54FNN265 pKa = 3.55
Molecular weight: 30.4 kDa
Isoelectric point according different methods:
Protein with the highest isoelectric point:
>tr|A0A5Q2W884|A0A5Q2W884_9VIRU ATP-dependent helicase Rep OS=CRESS virus sp. ctczB4 OX=2656682 PE=3 SV=1
MM1 pKa = 7.85IEE3 pKa = 4.61GSQQGKK9 pKa = 8.99VLQAMLLLTRR19 pKa = 11.84RR20 pKa = 11.84IQLLIVLFLLEE31 pKa = 3.69VLYY34 pKa = 10.56INKK37 pKa = 9.3SHH39 pKa = 6.54SSKK42 pKa = 9.74TGRR45 pKa = 11.84TISRR49 pKa = 11.84EE50 pKa = 3.78NEE52 pKa = 3.68LRR54 pKa = 11.84SS55 pKa = 3.48
MM1 pKa = 7.85IEE3 pKa = 4.61GSQQGKK9 pKa = 8.99VLQAMLLLTRR19 pKa = 11.84RR20 pKa = 11.84IQLLIVLFLLEE31 pKa = 3.69VLYY34 pKa = 10.56INKK37 pKa = 9.3SHH39 pKa = 6.54SSKK42 pKa = 9.74TGRR45 pKa = 11.84TISRR49 pKa = 11.84EE50 pKa = 3.78NEE52 pKa = 3.68LRR54 pKa = 11.84SS55 pKa = 3.48
Molecular weight: 6.33 kDa
Isoelectric point according different methods:
Peptides (in silico digests for buttom-up proteomics)
Below you can find in silico digests of the whole proteome with Trypsin, Chymotrypsin, Trypsin+LysC, LysN, ArgC proteases suitable for different mass spec machines.| Try ESI |
 |
|---|
| ChTry ESI |
 |
|---|
| ArgC ESI |
 |
|---|
| LysN ESI |
 |
|---|
| TryLysC ESI |
 |
|---|
| Try MALDI |
 |
|---|
| ChTry MALDI |
 |
|---|
| ArgC MALDI |
 |
|---|
| LysN MALDI |
 |
|---|
| TryLysC MALDI |
 |
|---|
| Try LTQ |
 |
|---|
| ChTry LTQ |
 |
|---|
| ArgC LTQ |
 |
|---|
| LysN LTQ |
 |
|---|
| TryLysC LTQ |
 |
|---|
| Try MSlow |
 |
|---|
| ChTry MSlow |
 |
|---|
| ArgC MSlow |
 |
|---|
| LysN MSlow |
 |
|---|
| TryLysC MSlow |
 |
|---|
| Try MShigh |
 |
|---|
| ChTry MShigh |
 |
|---|
| ArgC MShigh |
 |
|---|
| LysN MShigh |
 |
|---|
| TryLysC MShigh |
 |
|---|
General Statistics
Number of major isoforms |
Number of additional isoforms |
Number of all proteins |
Number of amino acids |
Min. Seq. Length |
Max. Seq. Length |
Avg. Seq. Length |
Avg. Mol. Weight |
|---|---|---|---|---|---|---|---|
0 |
960 |
55 |
640 |
320.0 |
35.65 |
Amino acid frequency
Ala |
Cys |
Asp |
Glu |
Phe |
Gly |
His |
Ile |
Lys |
Leu |
|---|---|---|---|---|---|---|---|---|---|
7.604 ± 1.157 | 1.146 ± 0.352 |
3.646 ± 0.709 | 5.104 ± 0.937 |
3.854 ± 0.444 | 8.438 ± 0.68 |
1.146 ± 0.536 | 5.833 ± 0.748 |
5.0 ± 0.688 | 6.875 ± 2.692 |
Met |
Asn |
Gln |
Pro |
Arg |
Ser |
Thr |
Val |
Trp |
Tyr |
|---|---|---|---|---|---|---|---|---|---|
2.188 ± 0.78 | 4.792 ± 1.181 |
4.271 ± 0.831 | 4.688 ± 0.673 |
7.292 ± 1.235 | 8.438 ± 0.492 |
6.563 ± 0.805 | 7.187 ± 0.535 |
1.979 ± 1.097 | 3.958 ± 0.538 |
Most of the basic statistics you can see at this page can be downloaded from this CSV file
Proteome-pI is available under Creative Commons Attribution-NoDerivs license, for more details see here
| Reference: Kozlowski LP. Proteome-pI 2.0: Proteome Isoelectric Point Database Update. Nucleic Acids Res. 2021, doi: 10.1093/nar/gkab944 | Contact: Lukasz P. Kozlowski |
