Cyanophage KBS-S-1A
Taxonomy: Viruses; Duplodnaviria; Heunggongvirae; Uroviricota; Caudoviricetes; Caudovirales; Autographiviridae; unclassified Autographiviridae
Average proteome isoelectric point is 6.06
Get precalculated fractions of proteins

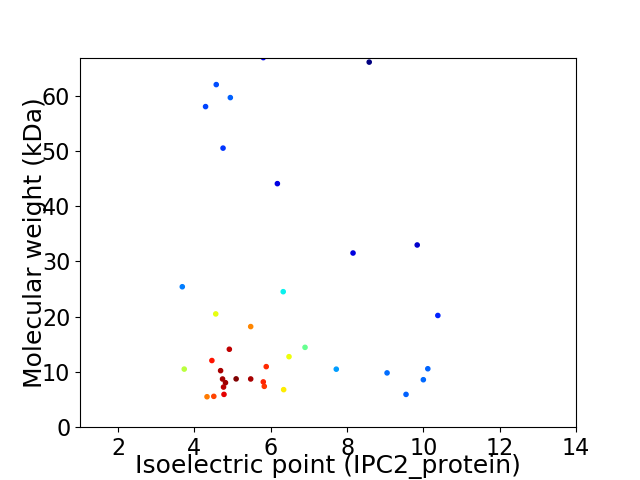
Virtual 2D-PAGE plot for 37 proteins (isoelectric point calculated using IPC2_protein)
Get csv file with sequences according to given criteria:
* You can choose from 21 different methods for calculating isoelectric point
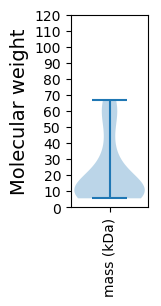
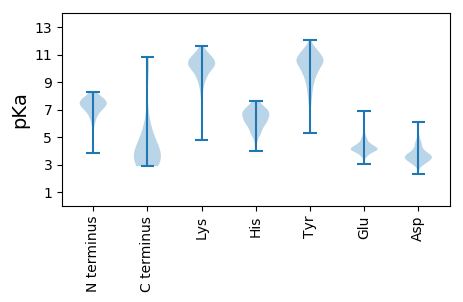
Summary statistics related to proteome-wise predictions


Protein with the lowest isoelectric point:
>tr|G8EXJ2|G8EXJ2_9CAUD Tail tubular protein (Fragment) OS=Cyanophage KBS-S-1A OX=889952 GN=CPVG_00022 PE=4 SV=1
MM1 pKa = 7.51AVTRR5 pKa = 11.84QDD7 pKa = 3.39YY8 pKa = 8.25TQAGSTITYY17 pKa = 7.29VVPFEE22 pKa = 4.53VIEE25 pKa = 4.2ATDD28 pKa = 2.93IDD30 pKa = 4.55VYY32 pKa = 11.23VNNVLQLQQNTTSTADD48 pKa = 3.12ATHH51 pKa = 6.44PQVISGEE58 pKa = 4.27ITQGTALTNYY68 pKa = 8.32TVASNNGTITFNAVLTAGDD87 pKa = 4.13YY88 pKa = 10.74IVVEE92 pKa = 4.41RR93 pKa = 11.84TTDD96 pKa = 3.37DD97 pKa = 3.1AA98 pKa = 6.67
MM1 pKa = 7.51AVTRR5 pKa = 11.84QDD7 pKa = 3.39YY8 pKa = 8.25TQAGSTITYY17 pKa = 7.29VVPFEE22 pKa = 4.53VIEE25 pKa = 4.2ATDD28 pKa = 2.93IDD30 pKa = 4.55VYY32 pKa = 11.23VNNVLQLQQNTTSTADD48 pKa = 3.12ATHH51 pKa = 6.44PQVISGEE58 pKa = 4.27ITQGTALTNYY68 pKa = 8.32TVASNNGTITFNAVLTAGDD87 pKa = 4.13YY88 pKa = 10.74IVVEE92 pKa = 4.41RR93 pKa = 11.84TTDD96 pKa = 3.37DD97 pKa = 3.1AA98 pKa = 6.67
Molecular weight: 10.52 kDa
Isoelectric point according different methods:
Protein with the highest isoelectric point:
>tr|G8EXK9|G8EXK9_9CAUD Uncharacterized protein (Fragment) OS=Cyanophage KBS-S-1A OX=889952 GN=CPVG_00040 PE=4 SV=1
DDD2 pKa = 3.84RR3 pKa = 11.84TLLNYYY9 pKa = 6.05TRR11 pKa = 11.84IEEE14 pKa = 4.38SNPTLISRR22 pKa = 11.84QTIGRR27 pKa = 11.84ITINWITSSRR37 pKa = 11.84TACLQTSKKK46 pKa = 11.51EEE48 pKa = 4.16SDDD51 pKa = 3.13RR52 pKa = 11.84TAITTEEE59 pKa = 3.79HH60 pKa = 6.98LSLSSSSRR68 pKa = 11.84VNKKK72 pKa = 10.21ATDDD76 pKa = 3.44LTDDD80 pKa = 3.49RR81 pKa = 11.84EEE83 pKa = 3.42RR84 pKa = 11.84YYY86 pKa = 10.4NIDDD90 pKa = 2.96KKK92 pKa = 11.23FLINSRR98 pKa = 11.84NHHH101 pKa = 6.19DDD103 pKa = 3.77ITSISRR109 pKa = 11.84SYYY112 pKa = 11.17ILNCPFRR119 pKa = 11.84VDDD122 pKa = 3.29DD123 pKa = 4.65VPIKKK128 pKa = 10.72IITVFRR134 pKa = 11.84VNVNNTRR141 pKa = 11.84LCSKKK146 pKa = 9.49TTRR149 pKa = 11.84SNTNPSRR156 pKa = 11.84TIPNRR161 pKa = 11.84KKK163 pKa = 8.76VIRR166 pKa = 11.84RR167 pKa = 11.84LLKKK171 pKa = 10.3RR172 pKa = 11.84LTYYY176 pKa = 10.49PVTTSRR182 pKa = 11.84GGVRR186 pKa = 11.84DDD188 pKa = 3.76SVKKK192 pKa = 10.36LRR194 pKa = 11.84GCSSSEEE201 pKa = 3.66VSISRR206 pKa = 11.84TRR208 pKa = 11.84CASILLRR215 pKa = 11.84LSDDD219 pKa = 4.17DD220 pKa = 3.83YYY222 pKa = 11.12FNLRR226 pKa = 11.84KKK228 pKa = 9.92NTTVSNAKKK237 pKa = 10.3YYY239 pKa = 8.64TVSRR243 pKa = 11.84TVNGDDD249 pKa = 4.1IAISNTRR256 pKa = 11.84CSNFNNTSLASSTLISRR273 pKa = 11.84NGDDD277 pKa = 3.47LVRR280 pKa = 11.84VSTASSISKKK290 pKa = 9.93DDD292 pKa = 3.34LAF
DDD2 pKa = 3.84RR3 pKa = 11.84TLLNYYY9 pKa = 6.05TRR11 pKa = 11.84IEEE14 pKa = 4.38SNPTLISRR22 pKa = 11.84QTIGRR27 pKa = 11.84ITINWITSSRR37 pKa = 11.84TACLQTSKKK46 pKa = 11.51EEE48 pKa = 4.16SDDD51 pKa = 3.13RR52 pKa = 11.84TAITTEEE59 pKa = 3.79HH60 pKa = 6.98LSLSSSSRR68 pKa = 11.84VNKKK72 pKa = 10.21ATDDD76 pKa = 3.44LTDDD80 pKa = 3.49RR81 pKa = 11.84EEE83 pKa = 3.42RR84 pKa = 11.84YYY86 pKa = 10.4NIDDD90 pKa = 2.96KKK92 pKa = 11.23FLINSRR98 pKa = 11.84NHHH101 pKa = 6.19DDD103 pKa = 3.77ITSISRR109 pKa = 11.84SYYY112 pKa = 11.17ILNCPFRR119 pKa = 11.84VDDD122 pKa = 3.29DD123 pKa = 4.65VPIKKK128 pKa = 10.72IITVFRR134 pKa = 11.84VNVNNTRR141 pKa = 11.84LCSKKK146 pKa = 9.49TTRR149 pKa = 11.84SNTNPSRR156 pKa = 11.84TIPNRR161 pKa = 11.84KKK163 pKa = 8.76VIRR166 pKa = 11.84RR167 pKa = 11.84LLKKK171 pKa = 10.3RR172 pKa = 11.84LTYYY176 pKa = 10.49PVTTSRR182 pKa = 11.84GGVRR186 pKa = 11.84DDD188 pKa = 3.76SVKKK192 pKa = 10.36LRR194 pKa = 11.84GCSSSEEE201 pKa = 3.66VSISRR206 pKa = 11.84TRR208 pKa = 11.84CASILLRR215 pKa = 11.84LSDDD219 pKa = 4.17DD220 pKa = 3.83YYY222 pKa = 11.12FNLRR226 pKa = 11.84KKK228 pKa = 9.92NTTVSNAKKK237 pKa = 10.3YYY239 pKa = 8.64TVSRR243 pKa = 11.84TVNGDDD249 pKa = 4.1IAISNTRR256 pKa = 11.84CSNFNNTSLASSTLISRR273 pKa = 11.84NGDDD277 pKa = 3.47LVRR280 pKa = 11.84VSTASSISKKK290 pKa = 9.93DDD292 pKa = 3.34LAF
Molecular weight: 32.99 kDa
Isoelectric point according different methods:
Peptides (in silico digests for buttom-up proteomics)
Below you can find in silico digests of the whole proteome with Trypsin, Chymotrypsin, Trypsin+LysC, LysN, ArgC proteases suitable for different mass spec machines.| Try ESI |
 |
|---|
| ChTry ESI |
 |
|---|
| ArgC ESI |
 |
|---|
| LysN ESI |
 |
|---|
| TryLysC ESI |
 |
|---|
| Try MALDI |
 |
|---|
| ChTry MALDI |
 |
|---|
| ArgC MALDI |
 |
|---|
| LysN MALDI |
 |
|---|
| TryLysC MALDI |
 |
|---|
| Try LTQ |
 |
|---|
| ChTry LTQ |
 |
|---|
| ArgC LTQ |
 |
|---|
| LysN LTQ |
 |
|---|
| TryLysC LTQ |
 |
|---|
| Try MSlow |
 |
|---|
| ChTry MSlow |
 |
|---|
| ArgC MSlow |
 |
|---|
| LysN MSlow |
 |
|---|
| TryLysC MSlow |
 |
|---|
| Try MShigh |
 |
|---|
| ChTry MShigh |
 |
|---|
| ArgC MShigh |
 |
|---|
| LysN MShigh |
 |
|---|
| TryLysC MShigh |
 |
|---|
General Statistics
Number of major isoforms |
Number of additional isoforms |
Number of all proteins |
Number of amino acids |
Min. Seq. Length |
Max. Seq. Length |
Avg. Seq. Length |
Avg. Mol. Weight |
|---|---|---|---|---|---|---|---|
0 |
7122 |
49 |
593 |
192.5 |
21.41 |
Amino acid frequency
Ala |
Cys |
Asp |
Glu |
Phe |
Gly |
His |
Ile |
Lys |
Leu |
|---|---|---|---|---|---|---|---|---|---|
8.972 ± 0.56 | 1.123 ± 0.22 |
6.529 ± 0.327 | 6.108 ± 0.537 |
3.51 ± 0.251 | 6.669 ± 0.51 |
1.755 ± 0.282 | 5.406 ± 0.277 |
5.673 ± 0.567 | 7.989 ± 0.492 |
Met |
Asn |
Gln |
Pro |
Arg |
Ser |
Thr |
Val |
Trp |
Tyr |
|---|---|---|---|---|---|---|---|---|---|
2.429 ± 0.349 | 5.293 ± 0.353 |
4.044 ± 0.24 | 3.777 ± 0.235 |
5.771 ± 0.47 | 7.329 ± 0.641 |
6.655 ± 0.461 | 6.094 ± 0.412 |
1.292 ± 0.133 | 3.58 ± 0.271 |
Most of the basic statistics you can see at this page can be downloaded from this CSV file
Proteome-pI is available under Creative Commons Attribution-NoDerivs license, for more details see here
| Reference: Kozlowski LP. Proteome-pI 2.0: Proteome Isoelectric Point Database Update. Nucleic Acids Res. 2021, doi: 10.1093/nar/gkab944 | Contact: Lukasz P. Kozlowski |
