Acetobacterium woodii (strain ATCC 29683 / DSM 1030 / JCM 2381 / KCTC 1655 / WB1)
Taxonomy: cellular organisms; Bacteria; Terrabacteria group; Firmicutes; Clostridia; Eubacteriales; Eubacteriaceae; Acetobacterium; Acetobacterium woodii
Average proteome isoelectric point is 6.06
Get precalculated fractions of proteins

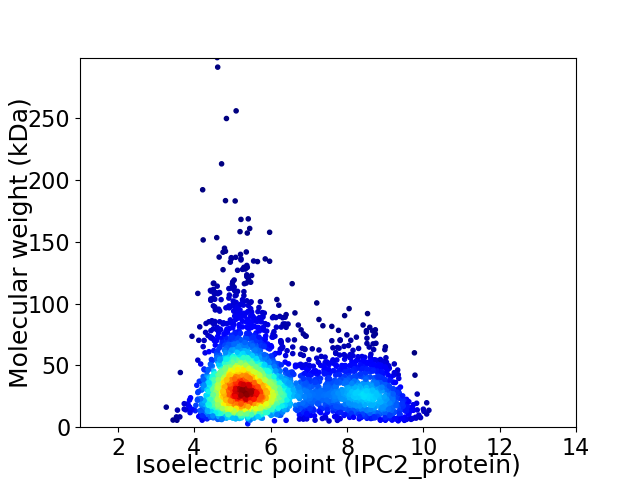
Virtual 2D-PAGE plot for 3445 proteins (isoelectric point calculated using IPC2_protein)
Get csv file with sequences according to given criteria:
* You can choose from 21 different methods for calculating isoelectric point
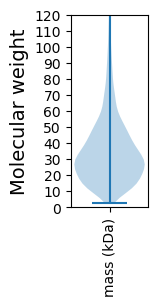
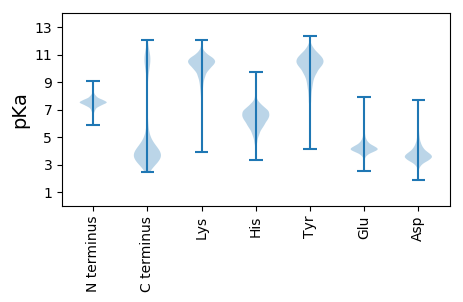
Summary statistics related to proteome-wise predictions


Protein with the lowest isoelectric point:
>tr|H6LDJ6|H6LDJ6_ACEWD NmrA domain-containing protein OS=Acetobacterium woodii (strain ATCC 29683 / DSM 1030 / JCM 2381 / KCTC 1655 / WB1) OX=931626 GN=Awo_c11840 PE=4 SV=1
MM1 pKa = 7.47KK2 pKa = 9.31EE3 pKa = 3.82KK4 pKa = 10.71LMAMSNWFVKK14 pKa = 8.15TTVKK18 pKa = 10.57QKK20 pKa = 9.01ITLGVCTVAVFSMVGLGIYY39 pKa = 8.75QLIPNQSDD47 pKa = 3.6GLNLDD52 pKa = 3.89GTNKK56 pKa = 9.86TNVTVNEE63 pKa = 4.04INEE66 pKa = 4.06AQAAEE71 pKa = 4.12AEE73 pKa = 4.43KK74 pKa = 10.64LANTAAEE81 pKa = 4.28TTPVEE86 pKa = 5.0SVSQTQNEE94 pKa = 4.28ATNVVSNTTTVNTPTTTEE112 pKa = 3.89DD113 pKa = 3.79VYY115 pKa = 11.13IADD118 pKa = 4.95DD119 pKa = 4.09GAHH122 pKa = 5.91YY123 pKa = 10.2EE124 pKa = 4.15SEE126 pKa = 4.29PVYY129 pKa = 10.8SEE131 pKa = 3.83PAYY134 pKa = 9.92EE135 pKa = 4.02EE136 pKa = 4.08PVYY139 pKa = 10.46EE140 pKa = 4.39EE141 pKa = 4.18PAAASDD147 pKa = 3.96GGWDD151 pKa = 3.78GDD153 pKa = 4.16LGGDD157 pKa = 4.92GASEE161 pKa = 3.97WQLSDD166 pKa = 4.19DD167 pKa = 3.71AGEE170 pKa = 4.25YY171 pKa = 8.62GTGISNN177 pKa = 4.05
MM1 pKa = 7.47KK2 pKa = 9.31EE3 pKa = 3.82KK4 pKa = 10.71LMAMSNWFVKK14 pKa = 8.15TTVKK18 pKa = 10.57QKK20 pKa = 9.01ITLGVCTVAVFSMVGLGIYY39 pKa = 8.75QLIPNQSDD47 pKa = 3.6GLNLDD52 pKa = 3.89GTNKK56 pKa = 9.86TNVTVNEE63 pKa = 4.04INEE66 pKa = 4.06AQAAEE71 pKa = 4.12AEE73 pKa = 4.43KK74 pKa = 10.64LANTAAEE81 pKa = 4.28TTPVEE86 pKa = 5.0SVSQTQNEE94 pKa = 4.28ATNVVSNTTTVNTPTTTEE112 pKa = 3.89DD113 pKa = 3.79VYY115 pKa = 11.13IADD118 pKa = 4.95DD119 pKa = 4.09GAHH122 pKa = 5.91YY123 pKa = 10.2EE124 pKa = 4.15SEE126 pKa = 4.29PVYY129 pKa = 10.8SEE131 pKa = 3.83PAYY134 pKa = 9.92EE135 pKa = 4.02EE136 pKa = 4.08PVYY139 pKa = 10.46EE140 pKa = 4.39EE141 pKa = 4.18PAAASDD147 pKa = 3.96GGWDD151 pKa = 3.78GDD153 pKa = 4.16LGGDD157 pKa = 4.92GASEE161 pKa = 3.97WQLSDD166 pKa = 4.19DD167 pKa = 3.71AGEE170 pKa = 4.25YY171 pKa = 8.62GTGISNN177 pKa = 4.05
Molecular weight: 18.81 kDa
Isoelectric point according different methods:
Protein with the highest isoelectric point:
>sp|P50002|ATPB_ACEWD ATP synthase subunit beta sodium ion specific OS=Acetobacterium woodii (strain ATCC 29683 / DSM 1030 / JCM 2381 / KCTC 1655 / WB1) OX=931626 GN=atpD PE=1 SV=3
MM1 pKa = 7.61LNTHH5 pKa = 6.28FRR7 pKa = 11.84NTKK10 pKa = 9.58LLCNVLQGLRR20 pKa = 11.84NRR22 pKa = 11.84YY23 pKa = 8.5FFASILSVRR32 pKa = 11.84AINAGMATGTSTKK45 pKa = 9.95ATINNEE51 pKa = 3.98RR52 pKa = 11.84IGYY55 pKa = 7.74LTEE58 pKa = 3.77TATAFPQNN66 pKa = 3.49
MM1 pKa = 7.61LNTHH5 pKa = 6.28FRR7 pKa = 11.84NTKK10 pKa = 9.58LLCNVLQGLRR20 pKa = 11.84NRR22 pKa = 11.84YY23 pKa = 8.5FFASILSVRR32 pKa = 11.84AINAGMATGTSTKK45 pKa = 9.95ATINNEE51 pKa = 3.98RR52 pKa = 11.84IGYY55 pKa = 7.74LTEE58 pKa = 3.77TATAFPQNN66 pKa = 3.49
Molecular weight: 7.34 kDa
Isoelectric point according different methods:
Peptides (in silico digests for buttom-up proteomics)
Below you can find in silico digests of the whole proteome with Trypsin, Chymotrypsin, Trypsin+LysC, LysN, ArgC proteases suitable for different mass spec machines.| Try ESI |
 |
|---|
| ChTry ESI |
 |
|---|
| ArgC ESI |
 |
|---|
| LysN ESI |
 |
|---|
| TryLysC ESI |
 |
|---|
| Try MALDI |
 |
|---|
| ChTry MALDI |
 |
|---|
| ArgC MALDI |
 |
|---|
| LysN MALDI |
 |
|---|
| TryLysC MALDI |
 |
|---|
| Try LTQ |
 |
|---|
| ChTry LTQ |
 |
|---|
| ArgC LTQ |
 |
|---|
| LysN LTQ |
 |
|---|
| TryLysC LTQ |
 |
|---|
| Try MSlow |
 |
|---|
| ChTry MSlow |
 |
|---|
| ArgC MSlow |
 |
|---|
| LysN MSlow |
 |
|---|
| TryLysC MSlow |
 |
|---|
| Try MShigh |
 |
|---|
| ChTry MShigh |
 |
|---|
| ArgC MShigh |
 |
|---|
| LysN MShigh |
 |
|---|
| TryLysC MShigh |
 |
|---|
General Statistics
Number of major isoforms |
Number of additional isoforms |
Number of all proteins |
Number of amino acids |
Min. Seq. Length |
Max. Seq. Length |
Avg. Seq. Length |
Avg. Mol. Weight |
|---|---|---|---|---|---|---|---|
0 |
1138432 |
22 |
2729 |
330.5 |
36.97 |
Amino acid frequency
Ala |
Cys |
Asp |
Glu |
Phe |
Gly |
His |
Ile |
Lys |
Leu |
|---|---|---|---|---|---|---|---|---|---|
7.218 ± 0.043 | 1.251 ± 0.018 |
5.587 ± 0.028 | 6.949 ± 0.043 |
4.347 ± 0.032 | 6.811 ± 0.037 |
1.68 ± 0.019 | 8.725 ± 0.039 |
7.123 ± 0.038 | 9.391 ± 0.036 |
Met |
Asn |
Gln |
Pro |
Arg |
Ser |
Thr |
Val |
Trp |
Tyr |
|---|---|---|---|---|---|---|---|---|---|
2.919 ± 0.021 | 5.169 ± 0.03 |
3.319 ± 0.023 | 3.462 ± 0.023 |
3.673 ± 0.025 | 5.753 ± 0.037 |
5.547 ± 0.04 | 6.604 ± 0.033 |
0.803 ± 0.013 | 3.67 ± 0.028 |
Most of the basic statistics you can see at this page can be downloaded from this CSV file
Proteome-pI is available under Creative Commons Attribution-NoDerivs license, for more details see here
| Reference: Kozlowski LP. Proteome-pI 2.0: Proteome Isoelectric Point Database Update. Nucleic Acids Res. 2021, doi: 10.1093/nar/gkab944 | Contact: Lukasz P. Kozlowski |
