Geomicrobium sp. JCM 19039
Taxonomy: cellular organisms; Bacteria; Terrabacteria group; Firmicutes; Bacilli; Bacillales; Bacillales incertae sedis; Geomicrobium; unclassified Geomicrobium
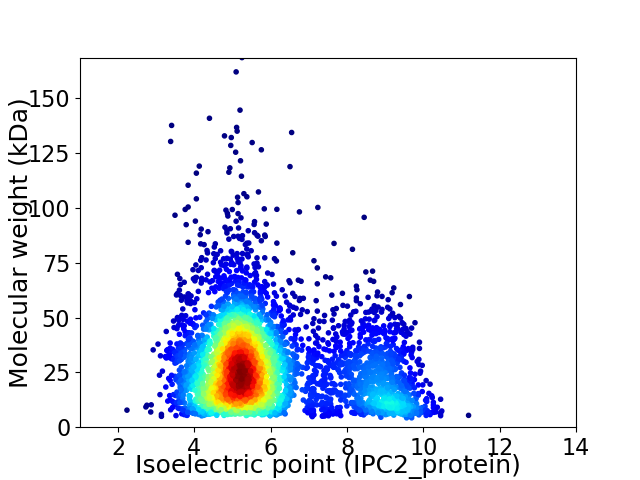
Average proteome isoelectric point is 5.97
Get precalculated fractions of proteins

Virtual 2D-PAGE plot for 4361 proteins (isoelectric point calculated using IPC2_protein)
Get csv file with sequences according to given criteria:
* You can choose from 21 different methods for calculating isoelectric point
Summary statistics related to proteome-wise predictions


Protein with the lowest isoelectric point:
>tr|A0A061PH61|A0A061PH61_9BACL TRAP-type C4-dicarboxylate transport system small permease component OS=Geomicrobium sp. JCM 19039 OX=1460636 GN=JCM19039_3949 PE=4 SV=1
MM1 pKa = 7.4TSKK4 pKa = 10.5KK5 pKa = 10.09HH6 pKa = 5.5LFAGIAGTAVLLAGCTSDD24 pKa = 4.53PGDD27 pKa = 3.58VDD29 pKa = 3.87EE30 pKa = 5.33SAAGSDD36 pKa = 3.83DD37 pKa = 3.48QGEE40 pKa = 4.52VAGGDD45 pKa = 3.71NFVMAVSSDD54 pKa = 2.89IDD56 pKa = 3.5TLDD59 pKa = 3.13PHH61 pKa = 6.88FATDD65 pKa = 3.58VPSSQVTTNIYY76 pKa = 7.06EE77 pKa = 4.33TLVEE81 pKa = 4.29HH82 pKa = 7.26DD83 pKa = 4.23EE84 pKa = 4.2NMEE87 pKa = 4.2VVPALAEE94 pKa = 3.99SFEE97 pKa = 5.11IIDD100 pKa = 3.98DD101 pKa = 4.05LTWEE105 pKa = 4.05FNIRR109 pKa = 11.84EE110 pKa = 4.39GVTFHH115 pKa = 7.71DD116 pKa = 5.1GEE118 pKa = 4.43PLDD121 pKa = 4.37AEE123 pKa = 4.3AVVTSFDD130 pKa = 3.54RR131 pKa = 11.84LFDD134 pKa = 4.38SDD136 pKa = 3.98EE137 pKa = 4.29LKK139 pKa = 10.76PRR141 pKa = 11.84ANMFEE146 pKa = 4.1LVEE149 pKa = 4.34DD150 pKa = 4.58VIAVDD155 pKa = 4.54DD156 pKa = 4.12YY157 pKa = 11.06TVHH160 pKa = 6.98FEE162 pKa = 4.0LSEE165 pKa = 4.14PFASLDD171 pKa = 3.34DD172 pKa = 4.58HH173 pKa = 6.45LTHH176 pKa = 6.63SAAAIISPQAIEE188 pKa = 3.99GHH190 pKa = 6.76DD191 pKa = 3.66NGDD194 pKa = 3.43VLLGTEE200 pKa = 4.84AYY202 pKa = 7.93GTGPFQLEE210 pKa = 3.78HH211 pKa = 6.72WEE213 pKa = 3.91QGNAIDD219 pKa = 4.84LGKK222 pKa = 10.39NEE224 pKa = 5.46DD225 pKa = 3.58YY226 pKa = 10.64WGDD229 pKa = 3.69EE230 pKa = 4.26PQVSTVSFNVVPEE243 pKa = 3.72QSTRR247 pKa = 11.84MGMLDD252 pKa = 3.02QGEE255 pKa = 4.44VHH257 pKa = 7.39FIDD260 pKa = 4.75QIEE263 pKa = 4.22PANAASVDD271 pKa = 4.06NINGASLLSQEE282 pKa = 4.17QLGFQSIAFNTDD294 pKa = 2.65VEE296 pKa = 4.57PFDD299 pKa = 5.46DD300 pKa = 4.74PDD302 pKa = 3.34VRR304 pKa = 11.84RR305 pKa = 11.84ALAMAIDD312 pKa = 4.14RR313 pKa = 11.84EE314 pKa = 4.44AIVEE318 pKa = 4.07GLYY321 pKa = 10.53SGYY324 pKa = 10.71GQVAKK329 pKa = 10.81GPLSPITFGYY339 pKa = 10.29SEE341 pKa = 4.21DD342 pKa = 3.99TEE344 pKa = 5.52AIEE347 pKa = 5.32HH348 pKa = 6.84DD349 pKa = 4.21LDD351 pKa = 4.18AAADD355 pKa = 4.0LLAEE359 pKa = 4.76AGYY362 pKa = 11.01EE363 pKa = 4.08DD364 pKa = 5.09GFSATLYY371 pKa = 10.63TNDD374 pKa = 4.07EE375 pKa = 4.02NHH377 pKa = 6.41SRR379 pKa = 11.84IQLAEE384 pKa = 3.83VAQDD388 pKa = 3.43YY389 pKa = 10.19FGQIGVDD396 pKa = 3.13ISIEE400 pKa = 3.93MMEE403 pKa = 3.82WGTYY407 pKa = 9.64LEE409 pKa = 4.97AMNSGNTEE417 pKa = 3.6IFISGWSTVTADD429 pKa = 4.13ADD431 pKa = 4.05YY432 pKa = 11.75AMHH435 pKa = 7.27PNFHH439 pKa = 6.86SDD441 pKa = 3.18NLGSEE446 pKa = 4.7GNNSFYY452 pKa = 11.4VNEE455 pKa = 4.44EE456 pKa = 3.48VDD458 pKa = 3.71EE459 pKa = 4.71LLDD462 pKa = 3.5EE463 pKa = 4.81ARR465 pKa = 11.84RR466 pKa = 11.84EE467 pKa = 3.91TDD469 pKa = 3.28DD470 pKa = 3.59EE471 pKa = 4.31VRR473 pKa = 11.84EE474 pKa = 4.0DD475 pKa = 4.61LYY477 pKa = 11.63AQAEE481 pKa = 4.15QIIINDD487 pKa = 3.5APQIFTVHH495 pKa = 6.3NDD497 pKa = 3.62YY498 pKa = 9.8ITGISDD504 pKa = 3.61SVDD507 pKa = 2.83GFVLQNNGIYY517 pKa = 10.49DD518 pKa = 4.02FSNVSISGDD527 pKa = 3.16AGGYY531 pKa = 9.06
MM1 pKa = 7.4TSKK4 pKa = 10.5KK5 pKa = 10.09HH6 pKa = 5.5LFAGIAGTAVLLAGCTSDD24 pKa = 4.53PGDD27 pKa = 3.58VDD29 pKa = 3.87EE30 pKa = 5.33SAAGSDD36 pKa = 3.83DD37 pKa = 3.48QGEE40 pKa = 4.52VAGGDD45 pKa = 3.71NFVMAVSSDD54 pKa = 2.89IDD56 pKa = 3.5TLDD59 pKa = 3.13PHH61 pKa = 6.88FATDD65 pKa = 3.58VPSSQVTTNIYY76 pKa = 7.06EE77 pKa = 4.33TLVEE81 pKa = 4.29HH82 pKa = 7.26DD83 pKa = 4.23EE84 pKa = 4.2NMEE87 pKa = 4.2VVPALAEE94 pKa = 3.99SFEE97 pKa = 5.11IIDD100 pKa = 3.98DD101 pKa = 4.05LTWEE105 pKa = 4.05FNIRR109 pKa = 11.84EE110 pKa = 4.39GVTFHH115 pKa = 7.71DD116 pKa = 5.1GEE118 pKa = 4.43PLDD121 pKa = 4.37AEE123 pKa = 4.3AVVTSFDD130 pKa = 3.54RR131 pKa = 11.84LFDD134 pKa = 4.38SDD136 pKa = 3.98EE137 pKa = 4.29LKK139 pKa = 10.76PRR141 pKa = 11.84ANMFEE146 pKa = 4.1LVEE149 pKa = 4.34DD150 pKa = 4.58VIAVDD155 pKa = 4.54DD156 pKa = 4.12YY157 pKa = 11.06TVHH160 pKa = 6.98FEE162 pKa = 4.0LSEE165 pKa = 4.14PFASLDD171 pKa = 3.34DD172 pKa = 4.58HH173 pKa = 6.45LTHH176 pKa = 6.63SAAAIISPQAIEE188 pKa = 3.99GHH190 pKa = 6.76DD191 pKa = 3.66NGDD194 pKa = 3.43VLLGTEE200 pKa = 4.84AYY202 pKa = 7.93GTGPFQLEE210 pKa = 3.78HH211 pKa = 6.72WEE213 pKa = 3.91QGNAIDD219 pKa = 4.84LGKK222 pKa = 10.39NEE224 pKa = 5.46DD225 pKa = 3.58YY226 pKa = 10.64WGDD229 pKa = 3.69EE230 pKa = 4.26PQVSTVSFNVVPEE243 pKa = 3.72QSTRR247 pKa = 11.84MGMLDD252 pKa = 3.02QGEE255 pKa = 4.44VHH257 pKa = 7.39FIDD260 pKa = 4.75QIEE263 pKa = 4.22PANAASVDD271 pKa = 4.06NINGASLLSQEE282 pKa = 4.17QLGFQSIAFNTDD294 pKa = 2.65VEE296 pKa = 4.57PFDD299 pKa = 5.46DD300 pKa = 4.74PDD302 pKa = 3.34VRR304 pKa = 11.84RR305 pKa = 11.84ALAMAIDD312 pKa = 4.14RR313 pKa = 11.84EE314 pKa = 4.44AIVEE318 pKa = 4.07GLYY321 pKa = 10.53SGYY324 pKa = 10.71GQVAKK329 pKa = 10.81GPLSPITFGYY339 pKa = 10.29SEE341 pKa = 4.21DD342 pKa = 3.99TEE344 pKa = 5.52AIEE347 pKa = 5.32HH348 pKa = 6.84DD349 pKa = 4.21LDD351 pKa = 4.18AAADD355 pKa = 4.0LLAEE359 pKa = 4.76AGYY362 pKa = 11.01EE363 pKa = 4.08DD364 pKa = 5.09GFSATLYY371 pKa = 10.63TNDD374 pKa = 4.07EE375 pKa = 4.02NHH377 pKa = 6.41SRR379 pKa = 11.84IQLAEE384 pKa = 3.83VAQDD388 pKa = 3.43YY389 pKa = 10.19FGQIGVDD396 pKa = 3.13ISIEE400 pKa = 3.93MMEE403 pKa = 3.82WGTYY407 pKa = 9.64LEE409 pKa = 4.97AMNSGNTEE417 pKa = 3.6IFISGWSTVTADD429 pKa = 4.13ADD431 pKa = 4.05YY432 pKa = 11.75AMHH435 pKa = 7.27PNFHH439 pKa = 6.86SDD441 pKa = 3.18NLGSEE446 pKa = 4.7GNNSFYY452 pKa = 11.4VNEE455 pKa = 4.44EE456 pKa = 3.48VDD458 pKa = 3.71EE459 pKa = 4.71LLDD462 pKa = 3.5EE463 pKa = 4.81ARR465 pKa = 11.84RR466 pKa = 11.84EE467 pKa = 3.91TDD469 pKa = 3.28DD470 pKa = 3.59EE471 pKa = 4.31VRR473 pKa = 11.84EE474 pKa = 4.0DD475 pKa = 4.61LYY477 pKa = 11.63AQAEE481 pKa = 4.15QIIINDD487 pKa = 3.5APQIFTVHH495 pKa = 6.3NDD497 pKa = 3.62YY498 pKa = 9.8ITGISDD504 pKa = 3.61SVDD507 pKa = 2.83GFVLQNNGIYY517 pKa = 10.49DD518 pKa = 4.02FSNVSISGDD527 pKa = 3.16AGGYY531 pKa = 9.06
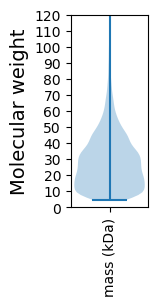
Molecular weight: 57.89 kDa
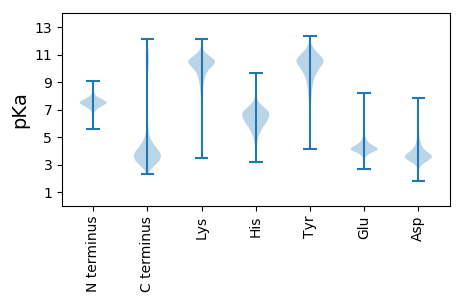
Isoelectric point according different methods:
Protein with the highest isoelectric point:
>tr|A0A061PAZ7|A0A061PAZ7_9BACL Ferric iron ABC transporter ATP-binding protein OS=Geomicrobium sp. JCM 19039 OX=1460636 GN=JCM19039_1818 PE=4 SV=1
MM1 pKa = 7.38SKK3 pKa = 8.63KK4 pKa = 8.77TFQPNNRR11 pKa = 11.84KK12 pKa = 9.23RR13 pKa = 11.84KK14 pKa = 8.02KK15 pKa = 8.47VHH17 pKa = 5.57GFRR20 pKa = 11.84SRR22 pKa = 11.84MSTKK26 pKa = 10.33NGRR29 pKa = 11.84LVLKK33 pKa = 10.39RR34 pKa = 11.84RR35 pKa = 11.84RR36 pKa = 11.84QKK38 pKa = 10.33GRR40 pKa = 11.84KK41 pKa = 8.52VLSAA45 pKa = 4.05
MM1 pKa = 7.38SKK3 pKa = 8.63KK4 pKa = 8.77TFQPNNRR11 pKa = 11.84KK12 pKa = 9.23RR13 pKa = 11.84KK14 pKa = 8.02KK15 pKa = 8.47VHH17 pKa = 5.57GFRR20 pKa = 11.84SRR22 pKa = 11.84MSTKK26 pKa = 10.33NGRR29 pKa = 11.84LVLKK33 pKa = 10.39RR34 pKa = 11.84RR35 pKa = 11.84RR36 pKa = 11.84QKK38 pKa = 10.33GRR40 pKa = 11.84KK41 pKa = 8.52VLSAA45 pKa = 4.05
Molecular weight: 5.4 kDa
Isoelectric point according different methods:
Peptides (in silico digests for buttom-up proteomics)
Below you can find in silico digests of the whole proteome with Trypsin, Chymotrypsin, Trypsin+LysC, LysN, ArgC proteases suitable for different mass spec machines.| Try ESI |
 |
|---|
| ChTry ESI |
 |
|---|
| ArgC ESI |
 |
|---|
| LysN ESI |
 |
|---|
| TryLysC ESI |
 |
|---|
| Try MALDI |
 |
|---|
| ChTry MALDI |
 |
|---|
| ArgC MALDI |
 |
|---|
| LysN MALDI |
 |
|---|
| TryLysC MALDI |
 |
|---|
| Try LTQ |
 |
|---|
| ChTry LTQ |
 |
|---|
| ArgC LTQ |
 |
|---|
| LysN LTQ |
 |
|---|
| TryLysC LTQ |
 |
|---|
| Try MSlow |
 |
|---|
| ChTry MSlow |
 |
|---|
| ArgC MSlow |
 |
|---|
| LysN MSlow |
 |
|---|
| TryLysC MSlow |
 |
|---|
| Try MShigh |
 |
|---|
| ChTry MShigh |
 |
|---|
| ArgC MShigh |
 |
|---|
| LysN MShigh |
 |
|---|
| TryLysC MShigh |
 |
|---|
General Statistics
Number of major isoforms |
Number of additional isoforms |
Number of all proteins |
Number of amino acids |
Min. Seq. Length |
Max. Seq. Length |
Avg. Seq. Length |
Avg. Mol. Weight |
|---|---|---|---|---|---|---|---|
0 |
1148845 |
37 |
1524 |
263.4 |
29.47 |
Amino acid frequency
Ala |
Cys |
Asp |
Glu |
Phe |
Gly |
His |
Ile |
Lys |
Leu |
|---|---|---|---|---|---|---|---|---|---|
7.694 ± 0.036 | 0.64 ± 0.01 |
5.641 ± 0.042 | 7.707 ± 0.053 |
4.353 ± 0.035 | 7.034 ± 0.038 |
2.476 ± 0.023 | 6.875 ± 0.036 |
4.898 ± 0.041 | 9.517 ± 0.046 |
Met |
Asn |
Gln |
Pro |
Arg |
Ser |
Thr |
Val |
Trp |
Tyr |
|---|---|---|---|---|---|---|---|---|---|
2.985 ± 0.017 | 3.867 ± 0.029 |
3.773 ± 0.027 | 3.971 ± 0.025 |
4.781 ± 0.031 | 6.025 ± 0.024 |
5.819 ± 0.024 | 7.557 ± 0.037 |
1.088 ± 0.015 | 3.298 ± 0.022 |
Most of the basic statistics you can see at this page can be downloaded from this CSV file
Proteome-pI is available under Creative Commons Attribution-NoDerivs license, for more details see here
| Reference: Kozlowski LP. Proteome-pI 2.0: Proteome Isoelectric Point Database Update. Nucleic Acids Res. 2021, doi: 10.1093/nar/gkab944 | Contact: Lukasz P. Kozlowski |
