Mirabilis mosaic virus
Taxonomy: Viruses; Riboviria; Pararnavirae; Artverviricota; Revtraviricetes; Ortervirales; Caulimoviridae; Caulimovirus
Average proteome isoelectric point is 6.95
Get precalculated fractions of proteins

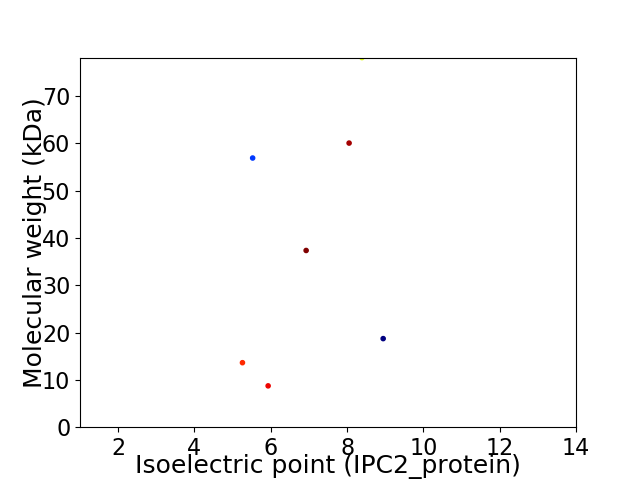
Virtual 2D-PAGE plot for 7 proteins (isoelectric point calculated using IPC2_protein)
Get csv file with sequences according to given criteria:
* You can choose from 21 different methods for calculating isoelectric point
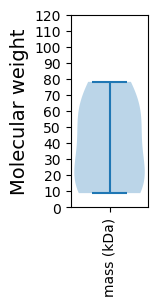
Summary statistics related to proteome-wise predictions


Protein with the lowest isoelectric point:
>tr|Q8JTA5|Q8JTA5_9VIRU Aphid transmission protein OS=Mirabilis mosaic virus OX=194445 PE=3 SV=1
MM1 pKa = 6.98STISEE6 pKa = 4.2LAVLIEE12 pKa = 4.01EE13 pKa = 4.56LKK15 pKa = 11.04KK16 pKa = 10.72EE17 pKa = 4.18VADD20 pKa = 4.38LVTTVKK26 pKa = 10.72DD27 pKa = 3.45LAKK30 pKa = 10.57DD31 pKa = 3.47KK32 pKa = 11.44SPEE35 pKa = 3.83TDD37 pKa = 3.12QNALKK42 pKa = 10.85SLGAKK47 pKa = 9.6IIKK50 pKa = 9.87DD51 pKa = 3.2ISDD54 pKa = 4.75KK55 pKa = 10.61IDD57 pKa = 3.11QCEE60 pKa = 4.23CTDD63 pKa = 4.04KK64 pKa = 11.44LFDD67 pKa = 3.81RR68 pKa = 11.84LKK70 pKa = 11.0GKK72 pKa = 10.76GSVIPTQQEE81 pKa = 4.01TPEE84 pKa = 3.95VSEE87 pKa = 3.9GAKK90 pKa = 7.88YY91 pKa = 10.27QKK93 pKa = 10.75YY94 pKa = 9.65SWPNHH99 pKa = 4.82NVGNPEE105 pKa = 4.33LGSSGVKK112 pKa = 10.5NPVYY116 pKa = 9.94WPPTSFPSS124 pKa = 3.36
MM1 pKa = 6.98STISEE6 pKa = 4.2LAVLIEE12 pKa = 4.01EE13 pKa = 4.56LKK15 pKa = 11.04KK16 pKa = 10.72EE17 pKa = 4.18VADD20 pKa = 4.38LVTTVKK26 pKa = 10.72DD27 pKa = 3.45LAKK30 pKa = 10.57DD31 pKa = 3.47KK32 pKa = 11.44SPEE35 pKa = 3.83TDD37 pKa = 3.12QNALKK42 pKa = 10.85SLGAKK47 pKa = 9.6IIKK50 pKa = 9.87DD51 pKa = 3.2ISDD54 pKa = 4.75KK55 pKa = 10.61IDD57 pKa = 3.11QCEE60 pKa = 4.23CTDD63 pKa = 4.04KK64 pKa = 11.44LFDD67 pKa = 3.81RR68 pKa = 11.84LKK70 pKa = 11.0GKK72 pKa = 10.76GSVIPTQQEE81 pKa = 4.01TPEE84 pKa = 3.95VSEE87 pKa = 3.9GAKK90 pKa = 7.88YY91 pKa = 10.27QKK93 pKa = 10.75YY94 pKa = 9.65SWPNHH99 pKa = 4.82NVGNPEE105 pKa = 4.33LGSSGVKK112 pKa = 10.5NPVYY116 pKa = 9.94WPPTSFPSS124 pKa = 3.36
Molecular weight: 13.64 kDa
Isoelectric point according different methods:
Protein with the highest isoelectric point:
>tr|Q8JTA6|Q8JTA6_9VIRU Uncharacterized protein OS=Mirabilis mosaic virus OX=194445 PE=3 SV=1
MM1 pKa = 7.61SNAQANPHH9 pKa = 6.57IYY11 pKa = 10.48KK12 pKa = 9.55KK13 pKa = 10.65DD14 pKa = 2.99KK15 pKa = 10.46YY16 pKa = 10.99VRR18 pKa = 11.84LKK20 pKa = 10.4PLEE23 pKa = 4.23PTSSKK28 pKa = 9.5KK29 pKa = 9.92RR30 pKa = 11.84RR31 pKa = 11.84YY32 pKa = 9.33IFASNDD38 pKa = 3.13EE39 pKa = 4.24TSSIKK44 pKa = 9.98TIAAHH49 pKa = 6.23CNNLNTIVAKK59 pKa = 10.68NWLKK63 pKa = 10.7LSKK66 pKa = 10.36LLSYY70 pKa = 10.86LGLEE74 pKa = 4.2KK75 pKa = 10.87DD76 pKa = 3.29EE77 pKa = 4.72SEE79 pKa = 4.7AYY81 pKa = 10.3SKK83 pKa = 11.5NKK85 pKa = 9.81VPFGNFFTKK94 pKa = 10.42LRR96 pKa = 11.84ASKK99 pKa = 10.67VGEE102 pKa = 4.38DD103 pKa = 3.61KK104 pKa = 11.18EE105 pKa = 4.36KK106 pKa = 10.02TANLLPTLQEE116 pKa = 3.67MSSRR120 pKa = 11.84IGKK123 pKa = 9.75ISEE126 pKa = 4.16EE127 pKa = 4.21TKK129 pKa = 10.61KK130 pKa = 10.67LAEE133 pKa = 4.27NDD135 pKa = 3.51VVTNKK140 pKa = 9.71QLEE143 pKa = 4.57TIIKK147 pKa = 10.42DD148 pKa = 3.31FDD150 pKa = 3.69RR151 pKa = 11.84RR152 pKa = 11.84LSEE155 pKa = 3.7IQNSVKK161 pKa = 10.7AIVGG165 pKa = 3.57
MM1 pKa = 7.61SNAQANPHH9 pKa = 6.57IYY11 pKa = 10.48KK12 pKa = 9.55KK13 pKa = 10.65DD14 pKa = 2.99KK15 pKa = 10.46YY16 pKa = 10.99VRR18 pKa = 11.84LKK20 pKa = 10.4PLEE23 pKa = 4.23PTSSKK28 pKa = 9.5KK29 pKa = 9.92RR30 pKa = 11.84RR31 pKa = 11.84YY32 pKa = 9.33IFASNDD38 pKa = 3.13EE39 pKa = 4.24TSSIKK44 pKa = 9.98TIAAHH49 pKa = 6.23CNNLNTIVAKK59 pKa = 10.68NWLKK63 pKa = 10.7LSKK66 pKa = 10.36LLSYY70 pKa = 10.86LGLEE74 pKa = 4.2KK75 pKa = 10.87DD76 pKa = 3.29EE77 pKa = 4.72SEE79 pKa = 4.7AYY81 pKa = 10.3SKK83 pKa = 11.5NKK85 pKa = 9.81VPFGNFFTKK94 pKa = 10.42LRR96 pKa = 11.84ASKK99 pKa = 10.67VGEE102 pKa = 4.38DD103 pKa = 3.61KK104 pKa = 11.18EE105 pKa = 4.36KK106 pKa = 10.02TANLLPTLQEE116 pKa = 3.67MSSRR120 pKa = 11.84IGKK123 pKa = 9.75ISEE126 pKa = 4.16EE127 pKa = 4.21TKK129 pKa = 10.61KK130 pKa = 10.67LAEE133 pKa = 4.27NDD135 pKa = 3.51VVTNKK140 pKa = 9.71QLEE143 pKa = 4.57TIIKK147 pKa = 10.42DD148 pKa = 3.31FDD150 pKa = 3.69RR151 pKa = 11.84RR152 pKa = 11.84LSEE155 pKa = 3.7IQNSVKK161 pKa = 10.7AIVGG165 pKa = 3.57
Molecular weight: 18.72 kDa
Isoelectric point according different methods:
Peptides (in silico digests for buttom-up proteomics)
Below you can find in silico digests of the whole proteome with Trypsin, Chymotrypsin, Trypsin+LysC, LysN, ArgC proteases suitable for different mass spec machines.| Try ESI |
 |
|---|
| ChTry ESI |
 |
|---|
| ArgC ESI |
 |
|---|
| LysN ESI |
 |
|---|
| TryLysC ESI |
 |
|---|
| Try MALDI |
 |
|---|
| ChTry MALDI |
 |
|---|
| ArgC MALDI |
 |
|---|
| LysN MALDI |
 |
|---|
| TryLysC MALDI |
 |
|---|
| Try LTQ |
 |
|---|
| ChTry LTQ |
 |
|---|
| ArgC LTQ |
 |
|---|
| LysN LTQ |
 |
|---|
| TryLysC LTQ |
 |
|---|
| Try MSlow |
 |
|---|
| ChTry MSlow |
 |
|---|
| ArgC MSlow |
 |
|---|
| LysN MSlow |
 |
|---|
| TryLysC MSlow |
 |
|---|
| Try MShigh |
 |
|---|
| ChTry MShigh |
 |
|---|
| ArgC MShigh |
 |
|---|
| LysN MShigh |
 |
|---|
| TryLysC MShigh |
 |
|---|
General Statistics
Number of major isoforms |
Number of additional isoforms |
Number of all proteins |
Number of amino acids |
Min. Seq. Length |
Max. Seq. Length |
Avg. Seq. Length |
Avg. Mol. Weight |
|---|---|---|---|---|---|---|---|
0 |
2384 |
75 |
674 |
340.6 |
39.07 |
Amino acid frequency
Ala |
Cys |
Asp |
Glu |
Phe |
Gly |
His |
Ile |
Lys |
Leu |
|---|---|---|---|---|---|---|---|---|---|
4.446 ± 0.57 | 1.468 ± 0.324 |
5.453 ± 0.212 | 8.305 ± 0.741 |
4.111 ± 0.402 | 4.404 ± 0.422 |
2.307 ± 0.327 | 7.928 ± 0.391 |
10.57 ± 0.519 | 8.221 ± 0.554 |
Met |
Asn |
Gln |
Pro |
Arg |
Ser |
Thr |
Val |
Trp |
Tyr |
|---|---|---|---|---|---|---|---|---|---|
1.971 ± 0.189 | 5.831 ± 0.581 |
4.698 ± 0.511 | 4.237 ± 0.238 |
4.153 ± 0.425 | 8.012 ± 0.825 |
4.992 ± 0.238 | 4.782 ± 0.47 |
1.133 ± 0.18 | 2.978 ± 0.262 |
Most of the basic statistics you can see at this page can be downloaded from this CSV file
Proteome-pI is available under Creative Commons Attribution-NoDerivs license, for more details see here
| Reference: Kozlowski LP. Proteome-pI 2.0: Proteome Isoelectric Point Database Update. Nucleic Acids Res. 2021, doi: 10.1093/nar/gkab944 | Contact: Lukasz P. Kozlowski |
