Aspergillus bombycis
Taxonomy: cellular organisms; Eukaryota; Opisthokonta; Fungi; Dikarya; Ascomycota; saccharomyceta; Pezizomycotina; leotiomyceta; Eurotiomycetes; Eurotiomycetidae; Eurotiales; Aspergillaceae; Aspergillus
Average proteome isoelectric point is 6.32
Get precalculated fractions of proteins
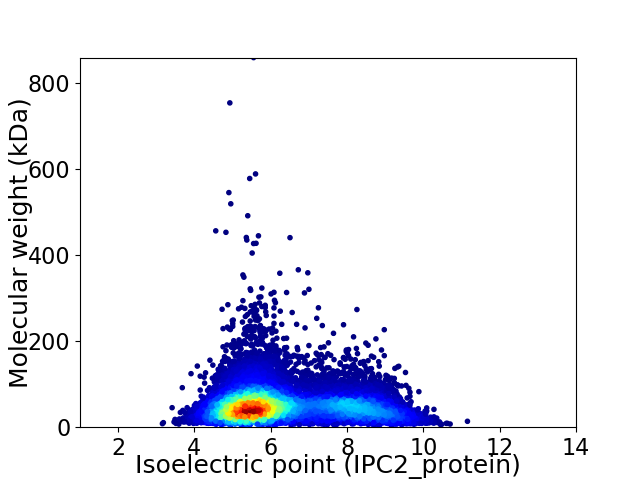
Virtual 2D-PAGE plot for 12265 proteins (isoelectric point calculated using IPC2_protein)
Get csv file with sequences according to given criteria:
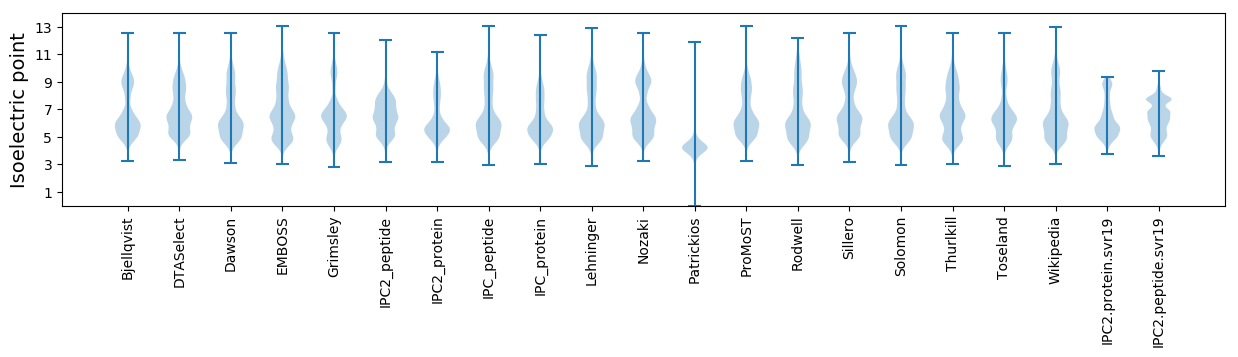
* You can choose from 21 different methods for calculating isoelectric point
Summary statistics related to proteome-wise predictions
Protein with the lowest isoelectric point:
>tr|A0A1F8AE64|A0A1F8AE64_9EURO Uncharacterized protein OS=Aspergillus bombycis OX=109264 GN=ABOM_001464 PE=4 SV=1
MM1 pKa = 7.55RR2 pKa = 11.84LVYY5 pKa = 10.01STVALTATALAVPVTVPSTYY25 pKa = 10.25HH26 pKa = 5.5RR27 pKa = 11.84TSTVPGKK34 pKa = 10.4VLEE37 pKa = 4.48ASNPSDD43 pKa = 4.22AGQLTARR50 pKa = 11.84TFGPLINWLGQLKK63 pKa = 10.45GGSSCEE69 pKa = 3.72EE70 pKa = 4.3CATGEE75 pKa = 4.22RR76 pKa = 11.84TGSDD80 pKa = 3.07SMGVSIDD87 pKa = 4.94SSAEE91 pKa = 3.8DD92 pKa = 4.33CNDD95 pKa = 3.26EE96 pKa = 4.44SSSNGNSNSNSNSNSNSNSNSNSNSNSNEE125 pKa = 3.47NSNTNTSGGSTDD137 pKa = 3.71SGSMPPGGMPPSGGTPPSGGTPPSGGMPPSGGTPPTGGTPPSGSTPPTSGTPPTGDD193 pKa = 3.22VPTGSTPSGTPPTSGTEE210 pKa = 3.96TGEE213 pKa = 4.11EE214 pKa = 4.12TGEE217 pKa = 4.18EE218 pKa = 4.34TGGSPPTSGTPPSGSTPPTSGTPPTGDD245 pKa = 3.17VPTSGGTPPSSGTEE259 pKa = 3.8TGITTGEE266 pKa = 4.01EE267 pKa = 4.28TGTSTGGSPPTGGKK281 pKa = 8.88PPSGSTPPSSGTEE294 pKa = 3.58NCEE297 pKa = 3.78ACEE300 pKa = 4.06KK301 pKa = 10.99GNNSGNNSGSSSSSSSSSSSSSSSSSSSSSSSSSSSSSSSSSSSSSSSSGGNHH354 pKa = 6.44ASANASGPNDD364 pKa = 3.61CAEE367 pKa = 4.64CEE369 pKa = 4.36VSVSVSPEE377 pKa = 3.64DD378 pKa = 4.81CEE380 pKa = 5.48DD381 pKa = 3.82FEE383 pKa = 4.94
MM1 pKa = 7.55RR2 pKa = 11.84LVYY5 pKa = 10.01STVALTATALAVPVTVPSTYY25 pKa = 10.25HH26 pKa = 5.5RR27 pKa = 11.84TSTVPGKK34 pKa = 10.4VLEE37 pKa = 4.48ASNPSDD43 pKa = 4.22AGQLTARR50 pKa = 11.84TFGPLINWLGQLKK63 pKa = 10.45GGSSCEE69 pKa = 3.72EE70 pKa = 4.3CATGEE75 pKa = 4.22RR76 pKa = 11.84TGSDD80 pKa = 3.07SMGVSIDD87 pKa = 4.94SSAEE91 pKa = 3.8DD92 pKa = 4.33CNDD95 pKa = 3.26EE96 pKa = 4.44SSSNGNSNSNSNSNSNSNSNSNSNSNSNEE125 pKa = 3.47NSNTNTSGGSTDD137 pKa = 3.71SGSMPPGGMPPSGGTPPSGGTPPSGGMPPSGGTPPTGGTPPSGSTPPTSGTPPTGDD193 pKa = 3.22VPTGSTPSGTPPTSGTEE210 pKa = 3.96TGEE213 pKa = 4.11EE214 pKa = 4.12TGEE217 pKa = 4.18EE218 pKa = 4.34TGGSPPTSGTPPSGSTPPTSGTPPTGDD245 pKa = 3.17VPTSGGTPPSSGTEE259 pKa = 3.8TGITTGEE266 pKa = 4.01EE267 pKa = 4.28TGTSTGGSPPTGGKK281 pKa = 8.88PPSGSTPPSSGTEE294 pKa = 3.58NCEE297 pKa = 3.78ACEE300 pKa = 4.06KK301 pKa = 10.99GNNSGNNSGSSSSSSSSSSSSSSSSSSSSSSSSSSSSSSSSSSSSSSSSGGNHH354 pKa = 6.44ASANASGPNDD364 pKa = 3.61CAEE367 pKa = 4.64CEE369 pKa = 4.36VSVSVSPEE377 pKa = 3.64DD378 pKa = 4.81CEE380 pKa = 5.48DD381 pKa = 3.82FEE383 pKa = 4.94
Molecular weight: 36.37 kDa
Isoelectric point according different methods:
Protein with the highest isoelectric point:
>tr|A0A1F8A7Z5|A0A1F8A7Z5_9EURO ABM domain-containing protein OS=Aspergillus bombycis OX=109264 GN=ABOM_002712 PE=4 SV=1
MM1 pKa = 7.61PSALRR6 pKa = 11.84TYY8 pKa = 10.02SSPMSMSRR16 pKa = 11.84YY17 pKa = 9.28LSPKK21 pKa = 7.62TTTTTPFSTLSSPLRR36 pKa = 11.84PMTNFTTAIRR46 pKa = 11.84PQLQTLSNTQLPSAATPSAQQSRR69 pKa = 11.84SFSASASLAGKK80 pKa = 9.59RR81 pKa = 11.84ATYY84 pKa = 10.03NPSRR88 pKa = 11.84RR89 pKa = 11.84VQKK92 pKa = 10.2RR93 pKa = 11.84RR94 pKa = 11.84HH95 pKa = 5.18GFLARR100 pKa = 11.84VRR102 pKa = 11.84SRR104 pKa = 11.84GGRR107 pKa = 11.84MIILRR112 pKa = 11.84RR113 pKa = 11.84RR114 pKa = 11.84AKK116 pKa = 10.07GRR118 pKa = 11.84KK119 pKa = 8.12SLSWW123 pKa = 3.4
MM1 pKa = 7.61PSALRR6 pKa = 11.84TYY8 pKa = 10.02SSPMSMSRR16 pKa = 11.84YY17 pKa = 9.28LSPKK21 pKa = 7.62TTTTTPFSTLSSPLRR36 pKa = 11.84PMTNFTTAIRR46 pKa = 11.84PQLQTLSNTQLPSAATPSAQQSRR69 pKa = 11.84SFSASASLAGKK80 pKa = 9.59RR81 pKa = 11.84ATYY84 pKa = 10.03NPSRR88 pKa = 11.84RR89 pKa = 11.84VQKK92 pKa = 10.2RR93 pKa = 11.84RR94 pKa = 11.84HH95 pKa = 5.18GFLARR100 pKa = 11.84VRR102 pKa = 11.84SRR104 pKa = 11.84GGRR107 pKa = 11.84MIILRR112 pKa = 11.84RR113 pKa = 11.84RR114 pKa = 11.84AKK116 pKa = 10.07GRR118 pKa = 11.84KK119 pKa = 8.12SLSWW123 pKa = 3.4
Molecular weight: 13.7 kDa
Isoelectric point according different methods:
Peptides (in silico digests for buttom-up proteomics)
Below you can find in silico digests of the whole proteome with Trypsin, Chymotrypsin, Trypsin+LysC, LysN, ArgC proteases suitable for different mass spec machines.| Try ESI |
 |
|---|
| ChTry ESI |
|
|---|
| ArgC ESI |
|
|---|
| LysN ESI |
|
|---|
| TryLysC ESI |
|
|---|
| Try MALDI |
|
|---|
| ChTry MALDI |
|
|---|
| ArgC MALDI |
|
|---|
| LysN MALDI |
|
|---|
| TryLysC MALDI |
|
|---|
| Try LTQ |
|
|---|
| ChTry LTQ |
|
|---|
| ArgC LTQ |
|
|---|
| LysN LTQ |
|
|---|
| TryLysC LTQ |
|
|---|
| Try MSlow |
|
|---|
| ChTry MSlow |
|
|---|
| ArgC MSlow |
|
|---|
| LysN MSlow |
|
|---|
| TryLysC MSlow |
|
|---|
| Try MShigh |
|
|---|
| ChTry MShigh |
|
|---|
| ArgC MShigh |
|
|---|
| LysN MShigh |
|
|---|
| TryLysC MShigh |
|
|---|
General Statistics
Number of major isoforms |
Number of additional isoforms |
Number of all proteins |
Number of amino acids |
Min. Seq. Length |
Max. Seq. Length |
Avg. Seq. Length |
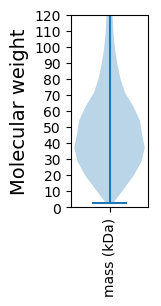
Avg. Mol. Weight |
|---|---|---|---|---|---|---|---|
0 |
6082457 |
21 |
7757 |
495.9 |
54.97 |
Amino acid frequency
Ala |
Cys |
Asp |
Glu |
Phe |
Gly |
His |
Ile |
Lys |
Leu |
|---|---|---|---|---|---|---|---|---|---|
8.367 ± 0.019 | 1.314 ± 0.008 |
5.597 ± 0.013 | 6.043 ± 0.023 |
3.824 ± 0.013 | 6.828 ± 0.018 |
2.453 ± 0.008 | 5.117 ± 0.013 |
4.515 ± 0.018 | 9.252 ± 0.023 |
Met |
Asn |
Gln |
Pro |
Arg |
Ser |
Thr |
Val |
Trp |
Tyr |
|---|---|---|---|---|---|---|---|---|---|
2.166 ± 0.006 | 3.673 ± 0.009 |
5.865 ± 0.023 | 4.043 ± 0.014 |
5.982 ± 0.019 | 8.229 ± 0.023 |
5.953 ± 0.014 | 6.321 ± 0.015 |
1.525 ± 0.009 | 2.933 ± 0.011 |
Most of the basic statistics you can see at this page can be downloaded from this CSV file
See this proteome in:

Proteome-pI is available under Creative Commons Attribution-NoDerivs license, for more details see here
| Reference: Kozlowski LP. Proteome-pI 2.0: Proteome Isoelectric Point Database Update. Nucleic Acids Res. 2021, doi: 10.1093/nar/gkab944 | Contact: Lukasz P. Kozlowski |