Lachnospiraceae bacterium
Taxonomy: cellular organisms; Bacteria; Terrabacteria group; Firmicutes; Clostridia; Eubacteriales; Lachnospiraceae; unclassified Lachnospiraceae
Average proteome isoelectric point is 5.85
Get precalculated fractions of proteins

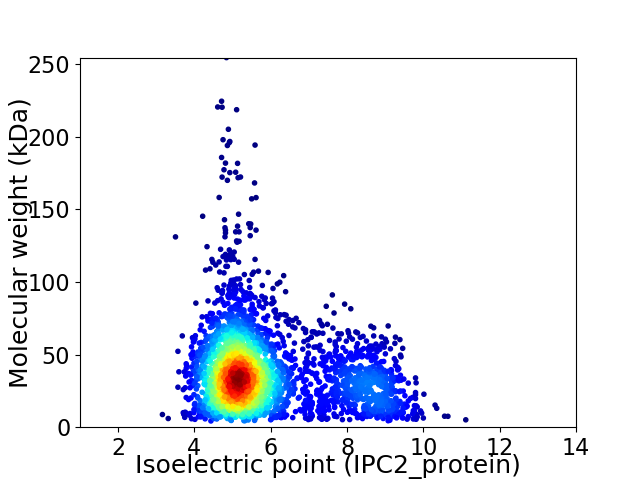
Virtual 2D-PAGE plot for 3259 proteins (isoelectric point calculated using IPC2_protein)
Get csv file with sequences according to given criteria:
* You can choose from 21 different methods for calculating isoelectric point
Summary statistics related to proteome-wise predictions


Protein with the lowest isoelectric point:
>tr|A0A1T5CBU8|A0A1T5CBU8_9FIRM Uncharacterized protein OS=Lachnospiraceae bacterium OX=1898203 GN=SAMN06296386_102177 PE=4 SV=1
MM1 pKa = 7.41KK2 pKa = 10.27KK3 pKa = 10.23KK4 pKa = 10.37LVSALLSATMVASLLAGCGNNASNSAPASEE34 pKa = 4.45AAPASEE40 pKa = 4.3AAPASEE46 pKa = 4.3AAPASEE52 pKa = 4.3AAPASEE58 pKa = 4.54AAPEE62 pKa = 3.95ANAAAGDD69 pKa = 3.96MTIGIAMPTKK79 pKa = 10.48SLEE82 pKa = 3.59RR83 pKa = 11.84WNRR86 pKa = 11.84DD87 pKa = 2.37GSYY90 pKa = 10.85LEE92 pKa = 4.28EE93 pKa = 4.03QFKK96 pKa = 11.1SRR98 pKa = 11.84GYY100 pKa = 10.1NVEE103 pKa = 3.94LTYY106 pKa = 11.03SDD108 pKa = 4.09NKK110 pKa = 10.15IDD112 pKa = 3.79QQVKK116 pKa = 10.46DD117 pKa = 3.95IEE119 pKa = 4.3GLIADD124 pKa = 4.36NVNLLVIAAIDD135 pKa = 4.09GEE137 pKa = 4.57SLSQVLAEE145 pKa = 4.61AKK147 pKa = 10.09EE148 pKa = 4.05SGIPVVSYY156 pKa = 11.22DD157 pKa = 3.78RR158 pKa = 11.84LIMNTDD164 pKa = 2.89AVSYY168 pKa = 9.96YY169 pKa = 11.15VSFDD173 pKa = 3.21NYY175 pKa = 10.76TVGTLQGQYY184 pKa = 10.93VIDD187 pKa = 5.21QLDD190 pKa = 3.91LDD192 pKa = 4.07NAGDD196 pKa = 3.37KK197 pKa = 10.17TYY199 pKa = 10.86NIEE202 pKa = 4.04FTAGDD207 pKa = 3.87PADD210 pKa = 3.81NNAGFFFNGAYY221 pKa = 7.94DD222 pKa = 3.69TLKK225 pKa = 10.53PYY227 pKa = 10.31IDD229 pKa = 4.67AGTLVIPSGQSTFDD243 pKa = 3.5QVATKK248 pKa = 10.21QWDD251 pKa = 3.47TATAMTRR258 pKa = 11.84MQNILASNYY267 pKa = 10.22SDD269 pKa = 3.39GTQLDD274 pKa = 3.79VALCSNDD281 pKa = 2.96STALGVTQAIEE292 pKa = 3.72SDD294 pKa = 3.9YY295 pKa = 11.6AGTNTVIITGQDD307 pKa = 2.89GDD309 pKa = 4.05EE310 pKa = 4.23ANLANVVDD318 pKa = 5.64GKK320 pKa = 11.17QSMTVYY326 pKa = 10.45KK327 pKa = 10.55AVANEE332 pKa = 3.94AVATLDD338 pKa = 4.26LADD341 pKa = 5.74AILKK345 pKa = 10.83GEE347 pKa = 4.24TPDD350 pKa = 4.49AGLIDD355 pKa = 3.75SAGWSFDD362 pKa = 3.29CAYY365 pKa = 9.91DD366 pKa = 3.7TEE368 pKa = 5.02SYY370 pKa = 11.68NNGTGIIPSYY380 pKa = 10.76LLVPTVVTTEE390 pKa = 3.87NLQKK394 pKa = 10.74EE395 pKa = 4.51LVDD398 pKa = 3.16TGYY401 pKa = 8.79YY402 pKa = 10.02TMGDD406 pKa = 3.5DD407 pKa = 5.33GYY409 pKa = 9.56PHH411 pKa = 7.46PVQQ414 pKa = 4.39
MM1 pKa = 7.41KK2 pKa = 10.27KK3 pKa = 10.23KK4 pKa = 10.37LVSALLSATMVASLLAGCGNNASNSAPASEE34 pKa = 4.45AAPASEE40 pKa = 4.3AAPASEE46 pKa = 4.3AAPASEE52 pKa = 4.3AAPASEE58 pKa = 4.54AAPEE62 pKa = 3.95ANAAAGDD69 pKa = 3.96MTIGIAMPTKK79 pKa = 10.48SLEE82 pKa = 3.59RR83 pKa = 11.84WNRR86 pKa = 11.84DD87 pKa = 2.37GSYY90 pKa = 10.85LEE92 pKa = 4.28EE93 pKa = 4.03QFKK96 pKa = 11.1SRR98 pKa = 11.84GYY100 pKa = 10.1NVEE103 pKa = 3.94LTYY106 pKa = 11.03SDD108 pKa = 4.09NKK110 pKa = 10.15IDD112 pKa = 3.79QQVKK116 pKa = 10.46DD117 pKa = 3.95IEE119 pKa = 4.3GLIADD124 pKa = 4.36NVNLLVIAAIDD135 pKa = 4.09GEE137 pKa = 4.57SLSQVLAEE145 pKa = 4.61AKK147 pKa = 10.09EE148 pKa = 4.05SGIPVVSYY156 pKa = 11.22DD157 pKa = 3.78RR158 pKa = 11.84LIMNTDD164 pKa = 2.89AVSYY168 pKa = 9.96YY169 pKa = 11.15VSFDD173 pKa = 3.21NYY175 pKa = 10.76TVGTLQGQYY184 pKa = 10.93VIDD187 pKa = 5.21QLDD190 pKa = 3.91LDD192 pKa = 4.07NAGDD196 pKa = 3.37KK197 pKa = 10.17TYY199 pKa = 10.86NIEE202 pKa = 4.04FTAGDD207 pKa = 3.87PADD210 pKa = 3.81NNAGFFFNGAYY221 pKa = 7.94DD222 pKa = 3.69TLKK225 pKa = 10.53PYY227 pKa = 10.31IDD229 pKa = 4.67AGTLVIPSGQSTFDD243 pKa = 3.5QVATKK248 pKa = 10.21QWDD251 pKa = 3.47TATAMTRR258 pKa = 11.84MQNILASNYY267 pKa = 10.22SDD269 pKa = 3.39GTQLDD274 pKa = 3.79VALCSNDD281 pKa = 2.96STALGVTQAIEE292 pKa = 3.72SDD294 pKa = 3.9YY295 pKa = 11.6AGTNTVIITGQDD307 pKa = 2.89GDD309 pKa = 4.05EE310 pKa = 4.23ANLANVVDD318 pKa = 5.64GKK320 pKa = 11.17QSMTVYY326 pKa = 10.45KK327 pKa = 10.55AVANEE332 pKa = 3.94AVATLDD338 pKa = 4.26LADD341 pKa = 5.74AILKK345 pKa = 10.83GEE347 pKa = 4.24TPDD350 pKa = 4.49AGLIDD355 pKa = 3.75SAGWSFDD362 pKa = 3.29CAYY365 pKa = 9.91DD366 pKa = 3.7TEE368 pKa = 5.02SYY370 pKa = 11.68NNGTGIIPSYY380 pKa = 10.76LLVPTVVTTEE390 pKa = 3.87NLQKK394 pKa = 10.74EE395 pKa = 4.51LVDD398 pKa = 3.16TGYY401 pKa = 8.79YY402 pKa = 10.02TMGDD406 pKa = 3.5DD407 pKa = 5.33GYY409 pKa = 9.56PHH411 pKa = 7.46PVQQ414 pKa = 4.39
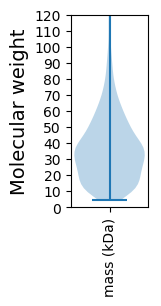
Molecular weight: 43.65 kDa
Isoelectric point according different methods:
Protein with the highest isoelectric point:
>tr|A0A1T5GLT3|A0A1T5GLT3_9FIRM Gamma-glutamyl phosphate reductase OS=Lachnospiraceae bacterium OX=1898203 GN=proA PE=3 SV=1
MM1 pKa = 7.72WMTFQPKK8 pKa = 9.16KK9 pKa = 8.53RR10 pKa = 11.84QRR12 pKa = 11.84SKK14 pKa = 9.17VHH16 pKa = 5.89GFRR19 pKa = 11.84ARR21 pKa = 11.84MSTPGGRR28 pKa = 11.84KK29 pKa = 8.8VLAARR34 pKa = 11.84RR35 pKa = 11.84AKK37 pKa = 10.26GRR39 pKa = 11.84AKK41 pKa = 10.1LTVV44 pKa = 3.04
MM1 pKa = 7.72WMTFQPKK8 pKa = 9.16KK9 pKa = 8.53RR10 pKa = 11.84QRR12 pKa = 11.84SKK14 pKa = 9.17VHH16 pKa = 5.89GFRR19 pKa = 11.84ARR21 pKa = 11.84MSTPGGRR28 pKa = 11.84KK29 pKa = 8.8VLAARR34 pKa = 11.84RR35 pKa = 11.84AKK37 pKa = 10.26GRR39 pKa = 11.84AKK41 pKa = 10.1LTVV44 pKa = 3.04
Molecular weight: 5.08 kDa
Isoelectric point according different methods:
Peptides (in silico digests for buttom-up proteomics)
Below you can find in silico digests of the whole proteome with Trypsin, Chymotrypsin, Trypsin+LysC, LysN, ArgC proteases suitable for different mass spec machines.| Try ESI |
 |
|---|
| ChTry ESI |
 |
|---|
| ArgC ESI |
 |
|---|
| LysN ESI |
 |
|---|
| TryLysC ESI |
 |
|---|
| Try MALDI |
 |
|---|
| ChTry MALDI |
 |
|---|
| ArgC MALDI |
 |
|---|
| LysN MALDI |
 |
|---|
| TryLysC MALDI |
 |
|---|
| Try LTQ |
 |
|---|
| ChTry LTQ |
 |
|---|
| ArgC LTQ |
 |
|---|
| LysN LTQ |
 |
|---|
| TryLysC LTQ |
 |
|---|
| Try MSlow |
 |
|---|
| ChTry MSlow |
 |
|---|
| ArgC MSlow |
 |
|---|
| LysN MSlow |
 |
|---|
| TryLysC MSlow |
 |
|---|
| Try MShigh |
 |
|---|
| ChTry MShigh |
 |
|---|
| ArgC MShigh |
 |
|---|
| LysN MShigh |
 |
|---|
| TryLysC MShigh |
 |
|---|
General Statistics
Number of major isoforms |
Number of additional isoforms |
Number of all proteins |
Number of amino acids |
Min. Seq. Length |
Max. Seq. Length |
Avg. Seq. Length |
Avg. Mol. Weight |
|---|---|---|---|---|---|---|---|
0 |
1122987 |
39 |
2305 |
344.6 |
38.58 |
Amino acid frequency
Ala |
Cys |
Asp |
Glu |
Phe |
Gly |
His |
Ile |
Lys |
Leu |
|---|---|---|---|---|---|---|---|---|---|
7.539 ± 0.045 | 1.322 ± 0.016 |
6.456 ± 0.04 | 7.488 ± 0.042 |
4.3 ± 0.032 | 7.077 ± 0.04 |
1.748 ± 0.017 | 7.464 ± 0.037 |
6.779 ± 0.034 | 8.353 ± 0.044 |
Met |
Asn |
Gln |
Pro |
Arg |
Ser |
Thr |
Val |
Trp |
Tyr |
|---|---|---|---|---|---|---|---|---|---|
3.053 ± 0.025 | 4.518 ± 0.033 |
3.258 ± 0.027 | 2.572 ± 0.02 |
4.472 ± 0.034 | 6.289 ± 0.038 |
5.345 ± 0.038 | 6.983 ± 0.033 |
0.892 ± 0.015 | 4.095 ± 0.033 |
Most of the basic statistics you can see at this page can be downloaded from this CSV file
Proteome-pI is available under Creative Commons Attribution-NoDerivs license, for more details see here
| Reference: Kozlowski LP. Proteome-pI 2.0: Proteome Isoelectric Point Database Update. Nucleic Acids Res. 2021, doi: 10.1093/nar/gkab944 | Contact: Lukasz P. Kozlowski |
